The UOB third quarter 2026 results, released on 4 November 2026, show a bank that is holding its ground in a tougher interest rate environment, with record fee income and steady underlying earnings even though the headline profit number fell from the previous quarter. United Overseas Bank (UOB) makes up 2.76% of my stock portfolio in terms of amount invested, so I went through the Chief Executive Officer slides, the Chief Financial Officer slides and the performance highlights to see what has changed since the last update.
In this post, I will walk through the key numbers, explain what drove them in plain language, look at asset quality and capital, and share how I am thinking about my UOB position as a dividend investor. If you missed my earlier coverage, you can read my notes on the UOB second quarter 2026 results and the UOB third quarter 2025 financial results for context.
UOB Third Quarter 2026 Results at a Glance
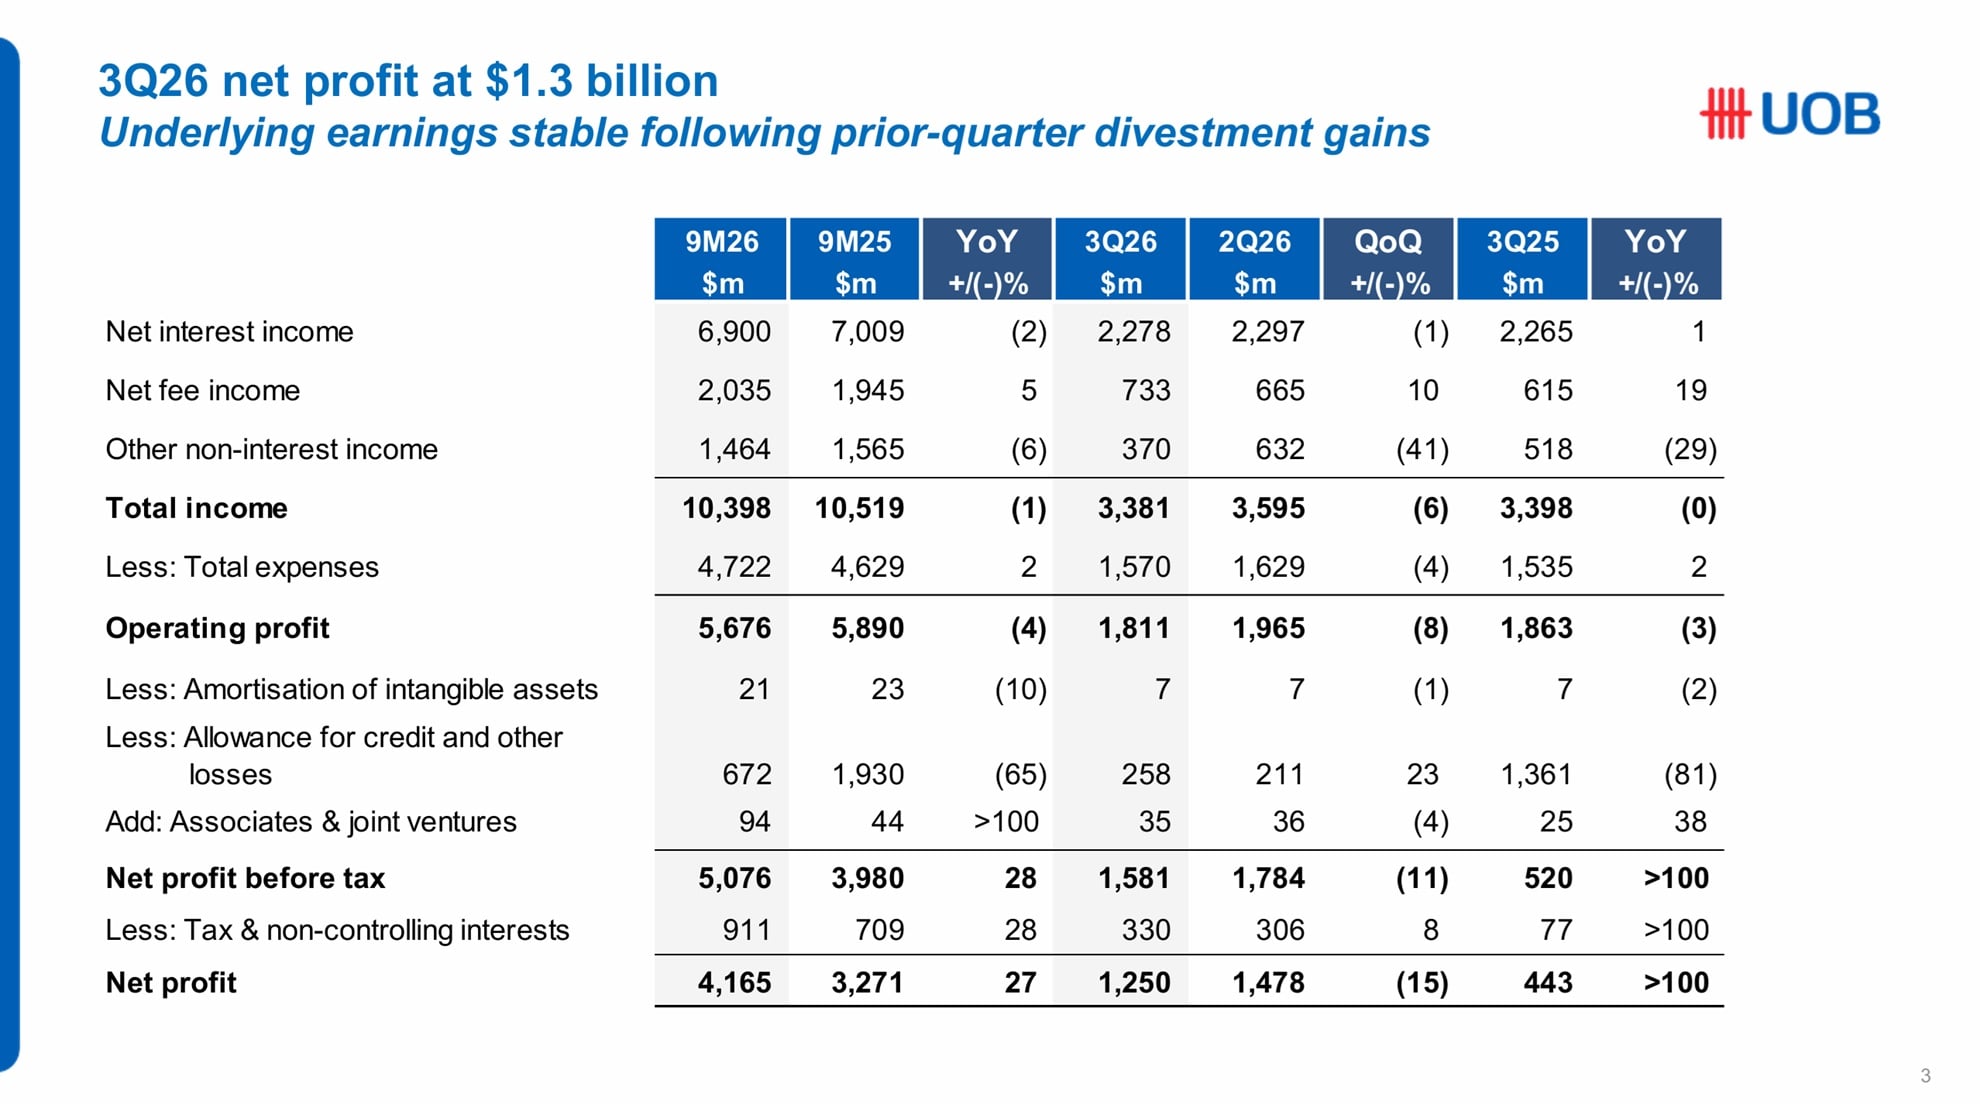
Table of Contents
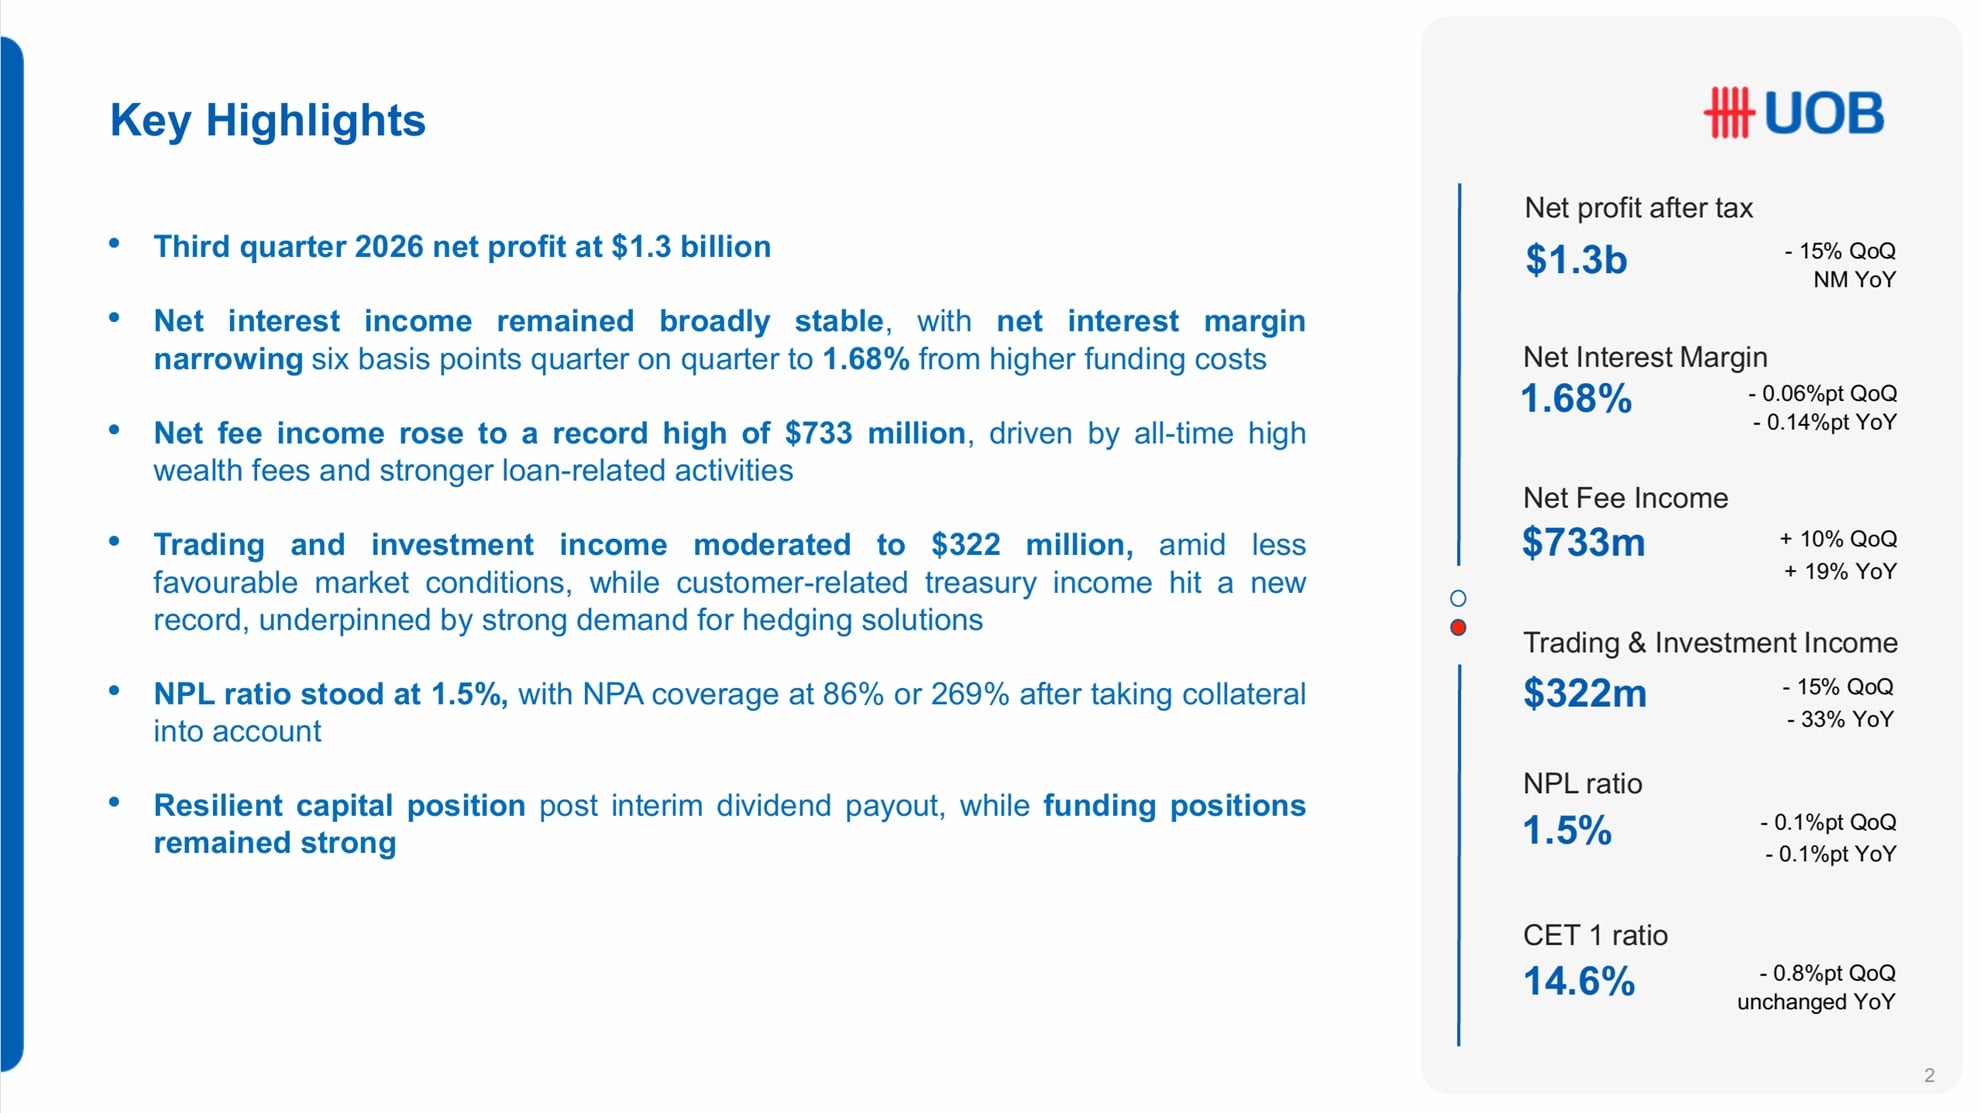
UOB reported a net profit of S$1.25 billion for the three months ended 30 September 2026. This was 15% lower than the S$1.48 billion it earned in the second quarter of 2026. The main reason for the drop is simple: the second quarter included one-off gains from selling some assets, and those gains did not repeat this quarter. Once I strip that out, the core business performed at a fairly similar level.
Compared with the same quarter last year, the jump looks enormous. Net profit in the third quarter of 2025 was only S$443 million, because the bank set aside a very large amount of provisions as a precaution at that time. The bank itself labels the year on year comparison as not meaningful, and I agree. It is more useful to look at the nine-month picture.
For the first nine months of 2026, net profit came in at S$4.17 billion, up 27% from S$3.27 billion in the same period of 2025. Again, much of this improvement comes from a lower base last year rather than a sudden surge in business activity. Total income for the nine months was roughly flat at S$10.4 billion, slipping about 1% year on year.
Return on average ordinary shareholders’ equity was 10.1% for the quarter on an annualised basis, down from 11.8% in the second quarter, while the nine-month figure stood at 11.1%. Net asset value per share was S$29.00 at the end of September, a little lower than S$29.99 in June after the interim dividend was paid out.
Net Interest Income Holds Steady Despite Margin Pressure
Net interest income is the difference between what a bank earns on loans and investments and what it pays out on deposits and other funding. It remains the largest income source for UOB. In the third quarter, net interest income was S$2.28 billion, down just 1% from the previous quarter and up 1% from a year ago.
The stability came from loan growth rather than better pricing. Net interest margin, which measures how much the bank earns on each dollar of interest-bearing assets, narrowed by six basis points to 1.68%, compared with 1.74% in the second quarter and 1.82% a year ago. For the full nine months, net interest margin was 1.75%, down from 1.91% in the same period last year.
What I found interesting this time is the reason behind the decline. Earlier in the year, the pressure on margins mainly came from falling interest rates, which reduced what the bank could earn on its loans. This quarter, the bigger drag came from higher funding costs. The breakdown in the Chief Financial Officer slides shows that funding costs took away about seven basis points from the margin, while asset repricing removed only about one basis point. Changes in the balance sheet mix added back roughly two basis points.
The slides also show that the average three-month Singapore Overnight Rate Average rose during the quarter. When local rates go up and competition for deposits is intense, banks have to pay more to keep fixed deposits, and that squeezes margins before loan pricing catches up. The current account and savings account ratio, which tracks the share of cheaper deposits, slipped to 54.6% from 55.6% in June and 57.0% a year ago. More customers are moving money into fixed deposits, which cost the bank more.
Record Fee Income Is the Highlight of the Quarter
The standout number in the UOB third quarter 2026 results is net fee income, which reached a record S$733 million. That is 10% higher than the previous quarter and 19% higher than a year ago. For the nine months, net fee income crossed S$2 billion for the first time, growing 5% year on year.
Wealth management was the main engine. Gross wealth fees rose to S$299 million in the quarter, compared with S$288 million in the second quarter and S$218 million a year ago. Loan and trade related fees also picked up strongly to S$293 million from S$246 million the quarter before, helped by stronger lending activity. Credit card fees were stable at around S$95 million.
Assets under management in the Privilege Banking and Private Bank segments stood at S$204 billion, unchanged from June but 3% higher than a year ago. The bank attracted about S$5 billion of net new money in the first nine months. More importantly, a larger portion of client money is now invested rather than sitting in deposits. The share of invested assets rose to 43% from 41% a year ago. Investment products tend to generate recurring fees, so this shift supports more stable income over time.
I like this trend because fee income does not depend on interest rates. As margins come under pressure, a bank with a growing wealth and fee business is better positioned to keep earnings steady. This is a theme I have been watching across all three local banks, which I compared in my post on DBS vs UOB vs OCBC.
Trading Income Softens but Customer Treasury Hits a New High
Other non-interest income fell sharply to S$370 million from S$632 million in the second quarter. Part of this is the absence of divestment gains, and part of it comes from weaker trading and investment income, which dropped to S$322 million. That is 15% lower than the previous quarter and 33% lower than a year ago, as market conditions were less favourable.
On a brighter note, treasury income from customers reached a new record of S$313 million in the quarter. Businesses have been buying more hedging products to protect themselves against currency and interest rate movements. This type of income comes from serving clients rather than from the bank taking its own market bets, so I see it as higher quality and more repeatable.
Costs Are Under Control
Total expenses fell 4% from the previous quarter to S$1.57 billion and were up only 2% from a year ago. Because income declined faster than costs this quarter, the cost-to-income ratio edged up to 46.4% from 45.3%. For the nine months, the cost-to-income ratio was 45.4%, compared with 44.0% in the same period last year.
Information technology related expenses continue to rise as the bank invests in its digital platforms, but staff costs dipped this quarter. Overall, I think cost discipline is reasonable, although the guidance for 2027 calls for operating costs to rise at a mid to high single-digit pace, so I will keep an eye on whether income grows fast enough to match.
Retail and Wholesale Banking Performance
Looking at the business segments for the first nine months, Group Retail delivered profit before tax of S$1.55 billion, roughly flat compared with last year. Wealth income grew 13% and credit card income jumped 25%, but income from lending and deposits fell 10% due to margin pressure. Retail customer deposits declined 3% as competition for savings intensified.
Group Wholesale Banking saw profit before tax rise 32% to S$2.82 billion, mainly because provisions returned to normal levels after a large build-up last year. Income itself fell 8%, as transaction banking and loan income were hit by lower rates. Still, there were encouraging signs on volume. Trade balances grew strongly to S$57 billion from S$44 billion a year ago, which lines up with the 31% trade loan growth highlighted by the bank. Total wholesale deposits rose 13%.
The Chief Executive Officer framed the bank around two growth engines: retail banking focused on deepening wealth relationships with more than eight million customers, and wholesale banking aiming to become part of the daily operations of its business clients through cash management, trade and digital platforms. He also mentioned plans to reinvest gains from recent divestments into capital-light businesses that broaden revenue sources.
Loans and Deposits Continue to Grow
Gross customer loans reached S$372 billion, up 3% from June and 6% from a year ago. Singapore remains the largest market at S$187 billion, followed by the four other key Association of Southeast Asian Nations markets at S$79 billion and Greater China at S$49 billion.
Customer deposits grew 2% quarter on quarter and 6% year on year to S$447 billion. The loan to deposit ratio was 82.5%, and liquidity remained comfortable, with the average all-currency liquidity coverage ratio at 152% and the net stable funding ratio at 112%. Both are well above the regulatory minimum of 100%.
Asset Quality: Stable Overall, but Greater China Needs Watching
The non-performing loan ratio improved slightly to 1.5% from 1.6% in the previous quarter. Total credit costs on loans came in at 24 basis points, which is within the bank’s guidance. Total allowances rose to S$258 million from S$211 million, mainly because the bank added a small amount of general provisions this quarter while specific provisions declined.
However, total non-performing assets edged up to S$5.83 billion from S$5.75 billion in June. The increase came from Greater China, where non-performing assets rose to S$2.46 billion, up from S$1.51 billion a year ago. The appendix shows that the non-performing loan ratio for Greater China real estate and hospitality exposures has climbed to 5.0%, with coverage for that segment falling to 40%. The bank describes these exposures as manageable and says it is repositioning the portfolio, with the share of real estate and hospitality in Greater China loans falling to 40% from 46% a year ago.
Coverage for non-performing assets across the group dropped to 86%, compared with 100% a year ago. After taking collateral into account, unsecured coverage stands at 269%, which provides some comfort. Still, the downward trend in coverage is one of the few areas in these results that I would describe as a concern. If more Greater China property loans turn bad, provisions could rise again.
Capital Position Remains Strong
The Common Equity Tier 1 ratio, which measures the bank’s core capital against its risk-weighted assets, fell to 14.6% from 15.4% in June. This drop was expected because the interim dividend was paid during the quarter. On a fully loaded basis, the ratio was 14.0%. Both figures are comfortably above the regulatory minimum, and the leverage ratio of 6.3% is also well above the 3% requirement.
For dividend investors like me, a strong capital buffer matters because it gives the bank room to keep paying dividends and to consider capital returns even when earnings soften. UOB did not announce a dividend with these quarterly results, as it typically declares dividends with its half-year and full-year results.
UOB Share Price, Dividend Yield and Valuation
UOB shares closed at S$36.88 on 6 November 2026, two days after the results were released. Here is how the stock looks at that price, based on the figures in the results and the dividends the bank has declared.
Over the past twelve months, UOB has declared a final dividend of 71 cents per share for the 2025 financial year and an interim dividend of 88 cents per share for the first half of 2026, which was paid on 28 August 2026. That adds up to S$1.59 per share, giving a trailing dividend yield of about 4.3% at S$36.88. If the bank keeps its payout ratio at roughly 50% and pays a final dividend similar to the interim, the forward yield would be closer to 4.8%. I treat that second number as an estimate only, because the final dividend will depend on full-year profit and the board’s decision.
On valuation, the share price works out to about 1.27 times the net asset value of S$29.00 per share. Using the annualised basic earnings per share of S$3.30 for the first nine months, the price to earnings ratio is roughly 11.2 times. If I use the weaker third quarter annualised earnings per share of S$2.98 instead, the ratio rises to about 12.4 times.
For a bank earning a return on equity of around 10% to 11%, a price of about 1.3 times book value looks reasonable to me rather than cheap or expensive. The dividend yield of above 4% is the main attraction for income investors, and it compares well with what I can currently get from Singapore Treasury Bills, although bank shares of course carry much more risk than government securities.
Management Outlook for 2027
Management shared its outlook for 2027. It expects loans to grow at a mid single-digit pace and net interest income to come in above the 2026 level, supported by balance sheet growth. Fee income is expected to grow at a mid to high single-digit rate, while operating costs are expected to rise at a similar mid to high single-digit pace. Total credit costs are guided at 25 to 30 basis points.
I read this guidance as cautiously positive. Expecting higher net interest income next year suggests management believes margin pressure is close to bottoming out, with volume growth doing the heavy lifting. The credit cost guidance is slightly higher than the 24 basis points seen this quarter, which tells me the bank is leaving some room for further provisions, especially in Greater China.
What the UOB Third Quarter 2026 Results Mean for My Portfolio
UOB currently represents 2.76% of my portfolio by amount invested, which makes it a meaningful but not oversized position. I hold it primarily for dividend income and long-term stability rather than rapid growth. At S$36.88, the trailing dividend yield of about 4.3% fits that purpose well.
Several things in this quarter reassure me. Fee income hit a record, wealth management continues to grow, customer treasury income is at a new high, costs are under control and capital remains strong. These are the qualities I look for in a bank I plan to hold for years.
There are also areas I will keep watching. Net interest margin continues to narrow, and this quarter the pressure came from higher deposit costs rather than lower lending rates. The share of cheaper deposits is falling, and non-performing assets in Greater China are rising while coverage ratios are trending down. None of these are alarming on their own, but together they suggest the next few quarters could be bumpy.
For now, I am comfortable holding my position. I do not plan to add aggressively, but I also see no reason to sell. I will revisit my view when UOB releases its full-year results and announces its final dividend in early 2027.
My Thoughts on UOB Third Quarter 2026 Results
Overall, the UOB third quarter 2026 results show a bank with solid underlying earnings, record fee income and a healthy balance sheet, even though headline profit dipped from the previous quarter due to the absence of one-off divestment gains. At a closing price of S$36.88, the shares offer a trailing dividend yield of about 4.3% and trade at around 1.27 times book value. Margin pressure and Greater China property exposure are the main risks to watch, while wealth management and transaction banking provide encouraging growth drivers. As a long-term dividend investor, I remain a patient holder of UOB shares and will continue to track how management delivers on its 2027 outlook.
This post reflects my personal views and is not financial advice. Please do your own research or speak with a licensed adviser before making any investment decisions.