
Singapore’s three local banking giants have all reported their first quarter 2026 results, and it is a good moment to step back and compare DBS, UOB and OCBC side by side (DBS vs UOB vs OCBC). In my own portfolio, they are not huge positions yet: DBS makes up 1.11% of my stock portfolio, UOB accounts for 2.96%, and OCBC is currently the largest of the three at 5.02% of my invested amount. With the share price of DBS closing at S$60.20, the UOB share price at S$37.30 and the OCBC share price at S$22.93 on Friday, 15 May 2026, the question is simple but important: based on their latest numbers, which bank deserves more capital today?
DBS vs UOB vs OCBC – Headline numbers: profitability and growth
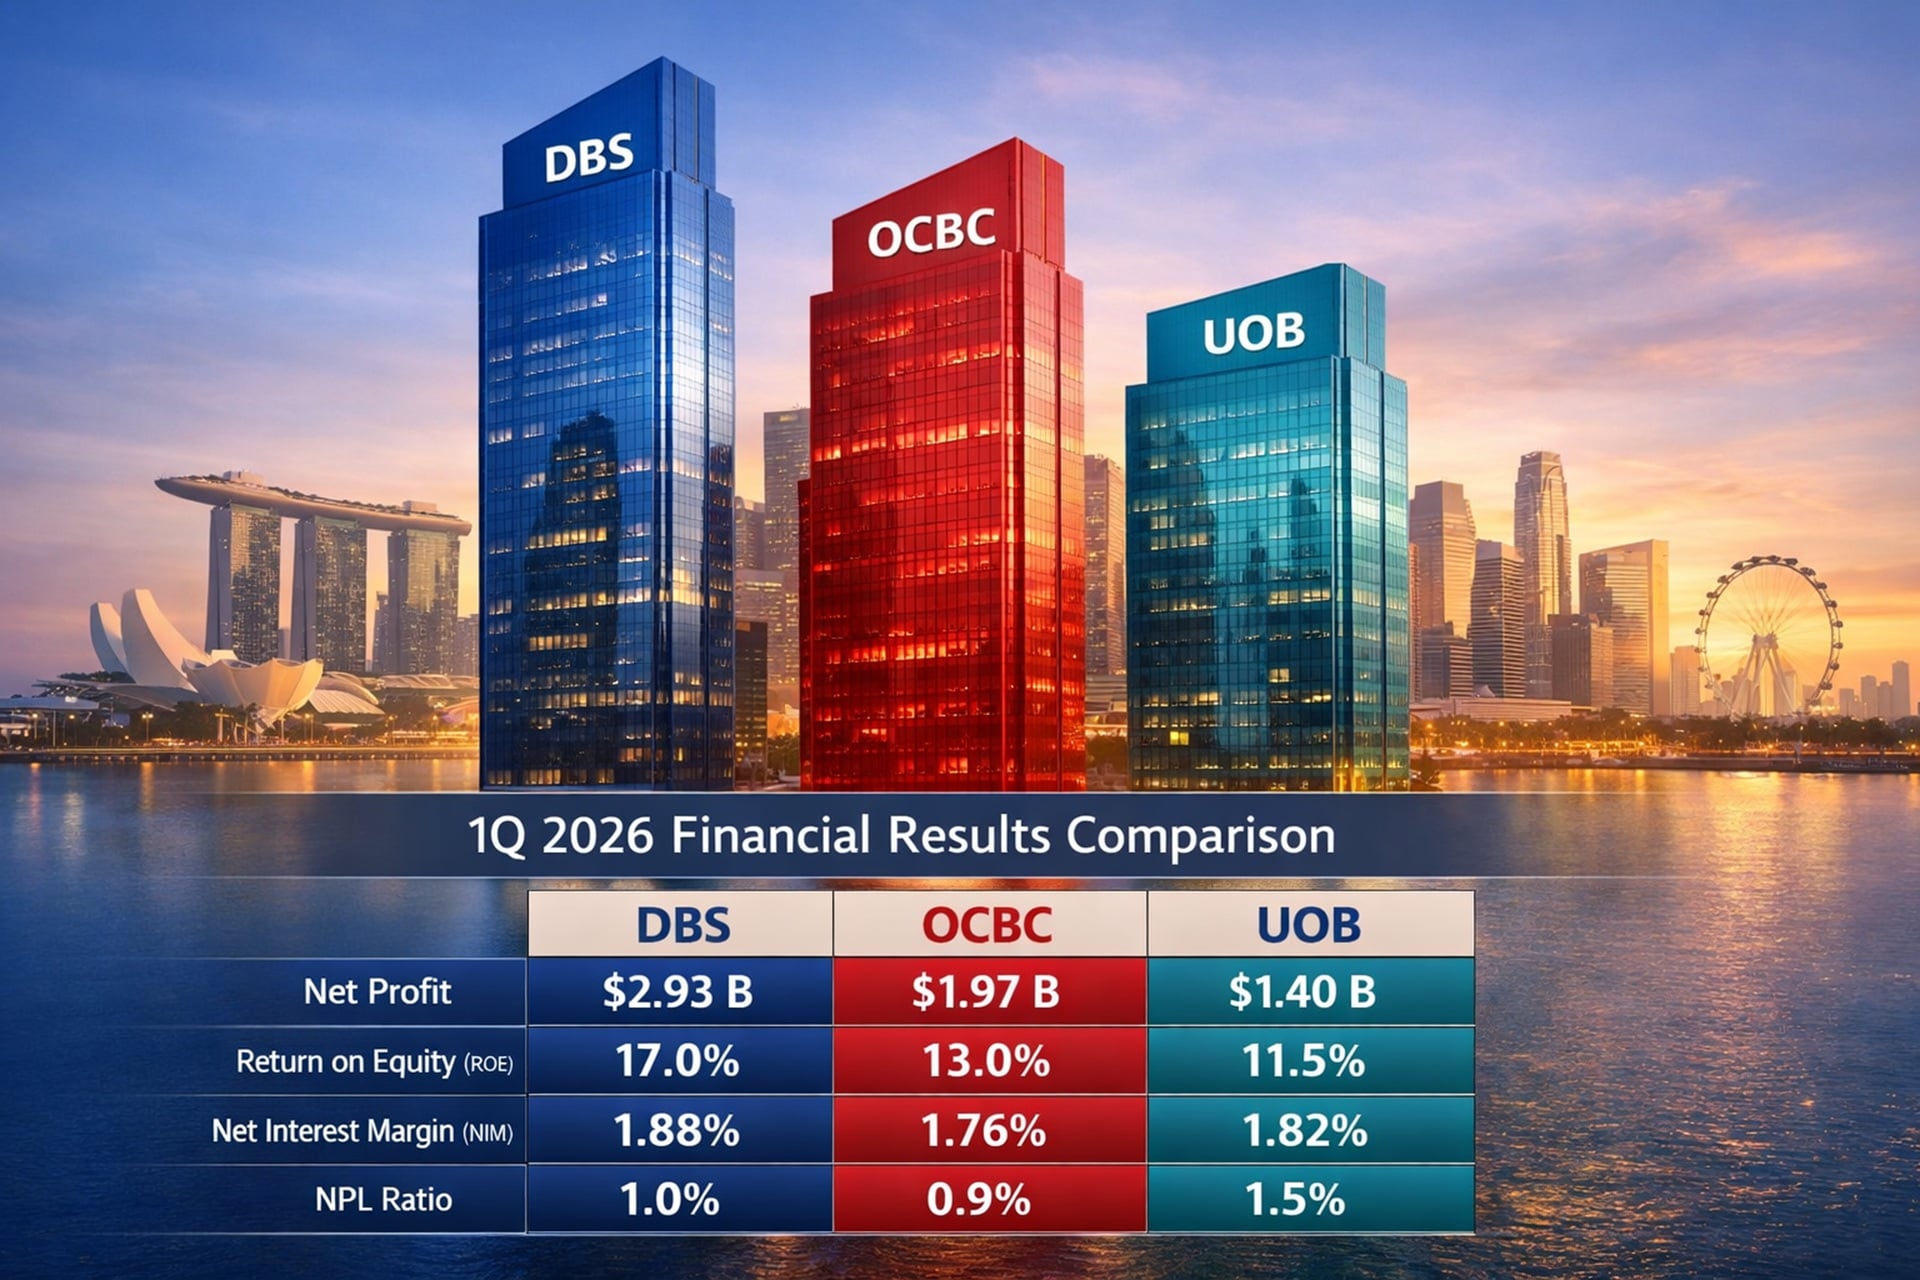
Starting with DBS, the group delivered another strong quarter. Net profit for 1Q 2026 came in at S$2.93 billion, up 1% year on year and 24% quarter on quarter, as total income reached a new record of S$5.95 billion and return on equity hit 17.0%. The DBS share price of S$60.20 clearly reflects this quality franchise and its ability to keep earnings high even as interest rates drift lower. Total income grew modestly, but the mix was healthy: fee income and treasury customer sales hit records, while markets trading income improved as funding costs eased and trading conditions normalised.
OCBC also posted a very solid set of results. Group net profit increased 5% to S$1.97 billion, underpinned by record non-interest income. Total income rose 5% year on year and 6% quarter on quarter to S$3.83 billion, with non-interest income jumping more than 20% on both comparisons. On an annualised basis, earnings per share reached S$1.76 and return on equity stood at 13.0%. The OCBC share price of S$22.93 does not look demanding when set against this earnings momentum and the bank’s strong capital position.
UOB’s 1Q 2026 numbers were more muted but still respectable. Net profit was S$1.4 billion, up 2% quarter on quarter but down 4% year on year, reflecting a softer operating environment after a very strong first quarter last year. Total income of S$3.42 billion was 4% higher quarter on quarter but 6% lower year on year, as net interest income and non-interest income both moderated versus the prior year. Return on equity was 11.5%, lower than DBS and OCBC, and the UOB share price in the market at S$37.30 seems to be pricing in this more modest profitability profile.
DBS vs UOB vs OCBC – Net interest income, margins and balance sheet growth
For all three banks, the rate cycle is turning into a headwind. DBS saw group net interest income decline 5% year on year, although on a day-adjusted basis it was little changed quarter on quarter. Net interest margin for the group eased to around the high 1.8% to 1.9% range, with the commercial book margin still above 2.2%. Deposit growth and hedging helped to offset the impact of lower benchmark rates such as SORA and SOFR. This ability to defend margins while growing deposits is one reason the share price of DBS commands a premium.
OCBC’s net interest income fell 5% year on year and 3% quarter on quarter to S$2.22 billion as net interest margin compressed to 1.76%, down 28 basis points year on year and 10 basis points quarter on quarter. The decline was driven by lower SGD, HKD and USD benchmark rates, partially offset by lower deposit costs and a 10% increase in average interest-earning assets. On a day-adjusted basis, net interest income was only 1% below the previous quarter, which is quite resilient. Loans grew 9% year on year and 2% quarter on quarter to S$347 billion, while customer deposits rose 10% year on year to S$444 billion with a CASA ratio of about 50%. When I look at the OCBC share price against this backdrop of steady loan and deposit growth, it feels like the market is not fully rewarding the bank’s underlying franchise strength.
UOB’s net interest income declined 4% year on year to S$2.32 billion and slipped 1% quarter on quarter, with net interest margin narrowing to 1.82% from 2.00% a year ago and 1.84% in the previous quarter. The bank still managed healthy loan growth of 4% year on year to S$354 billion, while customer deposits increased 6% year on year to S$427 billion. CASA deposits grew and CASA mix stayed close to 57%, supporting funding stability. The UOB share price in this context reflects a bank that is managing the rate downcycle reasonably well, but without the same earnings power as DBS or the same non-interest income surge as OCBC.
DBS vs UOB vs OCBC – Non-interest income and wealth management
One of the clearest differentiators this quarter is non-interest income. DBS delivered record fee income and record treasury customer sales. Wealth management fees, transaction services and card fees all contributed to a strong 14% year-on-year increase in gross fee income, with wealth-related fees growing in the mid-twenties percentage range. The wealth segment’s total income rose 7% year on year to S$1.59 billion, with assets under management climbing to S$492 billion and net new money of S$10 billion in the quarter. This fee engine is a key reason why the DBS share price can stay elevated even as net interest margin normalises.
OCBC’s non-interest income story is equally impressive. Non-interest income rose 23% year on year and 22% quarter on quarter to S$1.61 billion, making up more than 40% of total income. Fee income grew 24% to S$675 million, led by a 34% surge in wealth management fees, with strong contributions from private banking, bancassurance, unit trusts and other wealth products. Trading income increased 10% year on year, driven by record customer flow income, while insurance income jumped 34% on the back of higher new sales and improved margins. Group wealth management income reached S$1.48 billion, up 11% year on year, and contributed 39% of total income. When I compare this diversified fee base with the OCBC share price today, OCBC looks like a quietly powerful wealth and insurance franchise trading at a discount.
UOB’s non-interest income was more mixed. Net fee income of S$637 million was up 2% quarter on quarter but down 8% year on year, as last year’s first quarter was a record high. Wealth and capital market activities showed momentum, but investment banking and loan-related fees moderated in a more cautious, risk-off environment. Other non-interest income rose 45% quarter on quarter to S$462 million, supported by stronger customer treasury income and trading gains amid market volatility, but was still 17% lower year on year. The bank’s AUM stood at S$198 billion, up 5% year on year. Overall, UOB’s fee and trading profile is solid but not spectacular, and that is reflected in how the UOB share price trades relative to DBS and OCBC.
DBS vs UOB vs OCBC – Costs, asset quality and capital strength
On the cost front, DBS kept its cost-to-income ratio at 39%, with expenses up 4% year on year to S$2.30 billion. Staff costs rose, but other expenses normalised after a high fourth quarter. This level of efficiency is impressive given the bank’s ongoing investments in technology and growth initiatives. Credit costs were modest, with specific provisions at 14 basis points of loans and new non-performing asset formation low. The NPL ratio stayed at 1.0%, and allowance coverage was a healthy 131%, or 200% after collateral. The transitional CET1 ratio was 16.9%, with a fully phased-in CET1 ratio of 14.8%, giving DBS ample room to sustain its generous dividend and capital return programme. For investors watching the share price of DBS, this combination of high ROE, strong capital and disciplined risk management is exactly what justifies a premium valuation.
OCBC’s cost-to-income ratio was 39.3%, slightly higher than a year ago but still very comfortable. Operating expenses rose 6% year on year to S$1.50 billion, mainly from higher staff costs and continued IT investments, but fell 4% quarter on quarter as technology spending was seasonally higher in 4Q 2025. Asset quality remained excellent: the NPL ratio was unchanged at 0.9% for the eighth consecutive quarter, new corporate NPA formation was benign, and total NPA coverage increased to 163%. Total allowances were S$216 million, mostly for non-impaired assets, reflecting management overlays for macro uncertainties. The transitional CET1 ratio stood at 17.0%, and on a fully phased-in basis it was 15.2%, one of the highest in the region. When I weigh this prudence and capital strength against the OCBC share price, OCBC looks like a high-quality balance sheet available at a reasonable price.
UOB’s cost-to-income ratio was higher at 44.5%, though it improved from 46.4% in the previous quarter as income recovered while expenses stayed flat at S$1.52 billion. Asset quality was stable, with an NPL ratio of 1.5% and total credit costs on loans at 26 basis points, within management’s guided range. Non-performing asset coverage was 100%, or 272% after collateral, and performing loan coverage remained at 1.0%. The CET1 ratio was 15.3%, with a leverage ratio of 7.0%, indicating a robust capital position but slightly below DBS and OCBC. For the UOB share price, this means investors are getting a solid but not best-in-class risk-return profile, which usually translates into a valuation somewhere between DBS’s premium and OCBC’s discount.
DBS vs UOB vs OCBC – Valuation thoughts: which bank would I buy now?
Putting everything together, DBS clearly stands out on profitability and franchise strength. A 17% ROE, record total income, powerful wealth and fee engines, and a strong capital base justify why the share price of DBS is as high as S$60.20. The DBS share price also reflects the bank’s willingness and ability to return capital through both ordinary dividends and a recurring capital return dividend. For a long-term investor who prioritises quality and is comfortable paying up, DBS remains a core holding. However, at this level, the DBS share price already discounts a lot of good news, and any disappointment in growth or credit could lead to volatility.
OCBC, on the other hand, offers a different kind of appeal. Net profit growth of 5% year on year and 13% quarter on quarter, a rising contribution from wealth management and insurance, resilient asset quality with a 0.9% NPL ratio, and one of the strongest CET1 ratios in the region all paint the picture of a conservative but steadily compounding bank. Non-interest income is now more than 40% of total income, which reduces reliance on the rate cycle. Yet the OCBC share price is only S$22.93, and in my portfolio OCBC is still just 5.02% of invested capital. When I compare the OCBC share price to its earnings trajectory and capital strength, OCBC looks undervalued relative to its peers.
UOB sits somewhere in between. The bank has a resilient regional franchise, decent loan and CASA growth, and a strong capital and liquidity position. However, net profit is down year on year, ROE is lower than DBS and OCBC, and the cost-to-income ratio is higher. The UOB share price of S$37.30 reflects these trade-offs: investors get a solid ASEAN-focused bank with room to grow, but the earnings profile is not as compelling as DBS’s and the valuation is not as obviously cheap as OCBC’s. In my portfolio, UOB is 2.96% of invested capital, and I see it as a steady, middle-of-the-road holding rather than a high-conviction bargain or a premium compounder.
If I had to choose just one bank to invest in today based purely on the pros and cons of their first quarter 2026 financial results, I would still rank DBS as the best overall franchise. Its combination of high ROE, strong fee engines, robust capital and consistent execution is hard to beat, and over a long horizon that usually wins. But when I bring valuation and current market prices into the picture, my answer changes. At a DBS share price of S$60.20, much of that excellence is already priced in. At a UOB share price of S$37.30, I see fair value for a good but not outstanding bank. At an OCBC share price of S$22.93, I see a bank with accelerating non-interest income, pristine asset quality and very strong capital trading at what looks like a discount.
So based on today’s share prices, the bank I would buy now is OCBC. The OCBC share price offers, in my view, the best balance between quality, growth and valuation among the three. I will continue to hold DBS for its superior franchise and dividend stream, keep UOB as a stable regional player, but if I am adding fresh money after reviewing the first quarter 2026 results, OCBC is the one I am most inclined to accumulate at current levels.