Table of Contents
The OCBC Third Quarter 2026 Financial Results were released on 6 November 2026, and they show a bank whose core lending and wealth businesses are firing on all cylinders, even as its insurance arm, Great Eastern Holdings, had a tough quarter. In this post, I break down what happened in the quarter and the first nine months of 2026, what management expects for the rest of the year, and how I am thinking about OCBC as a shareholder.
OCBC shares closed at S$27.73 on 6 November 2026. OCBC makes up 4.68% of my stock portfolio in terms of amount invested, so these results matter to me personally. If you missed my earlier review, you can read my take on the OCBC First Half 2026 Financial Results for context.
OCBC Third Quarter 2026 Financial Results at a Glance
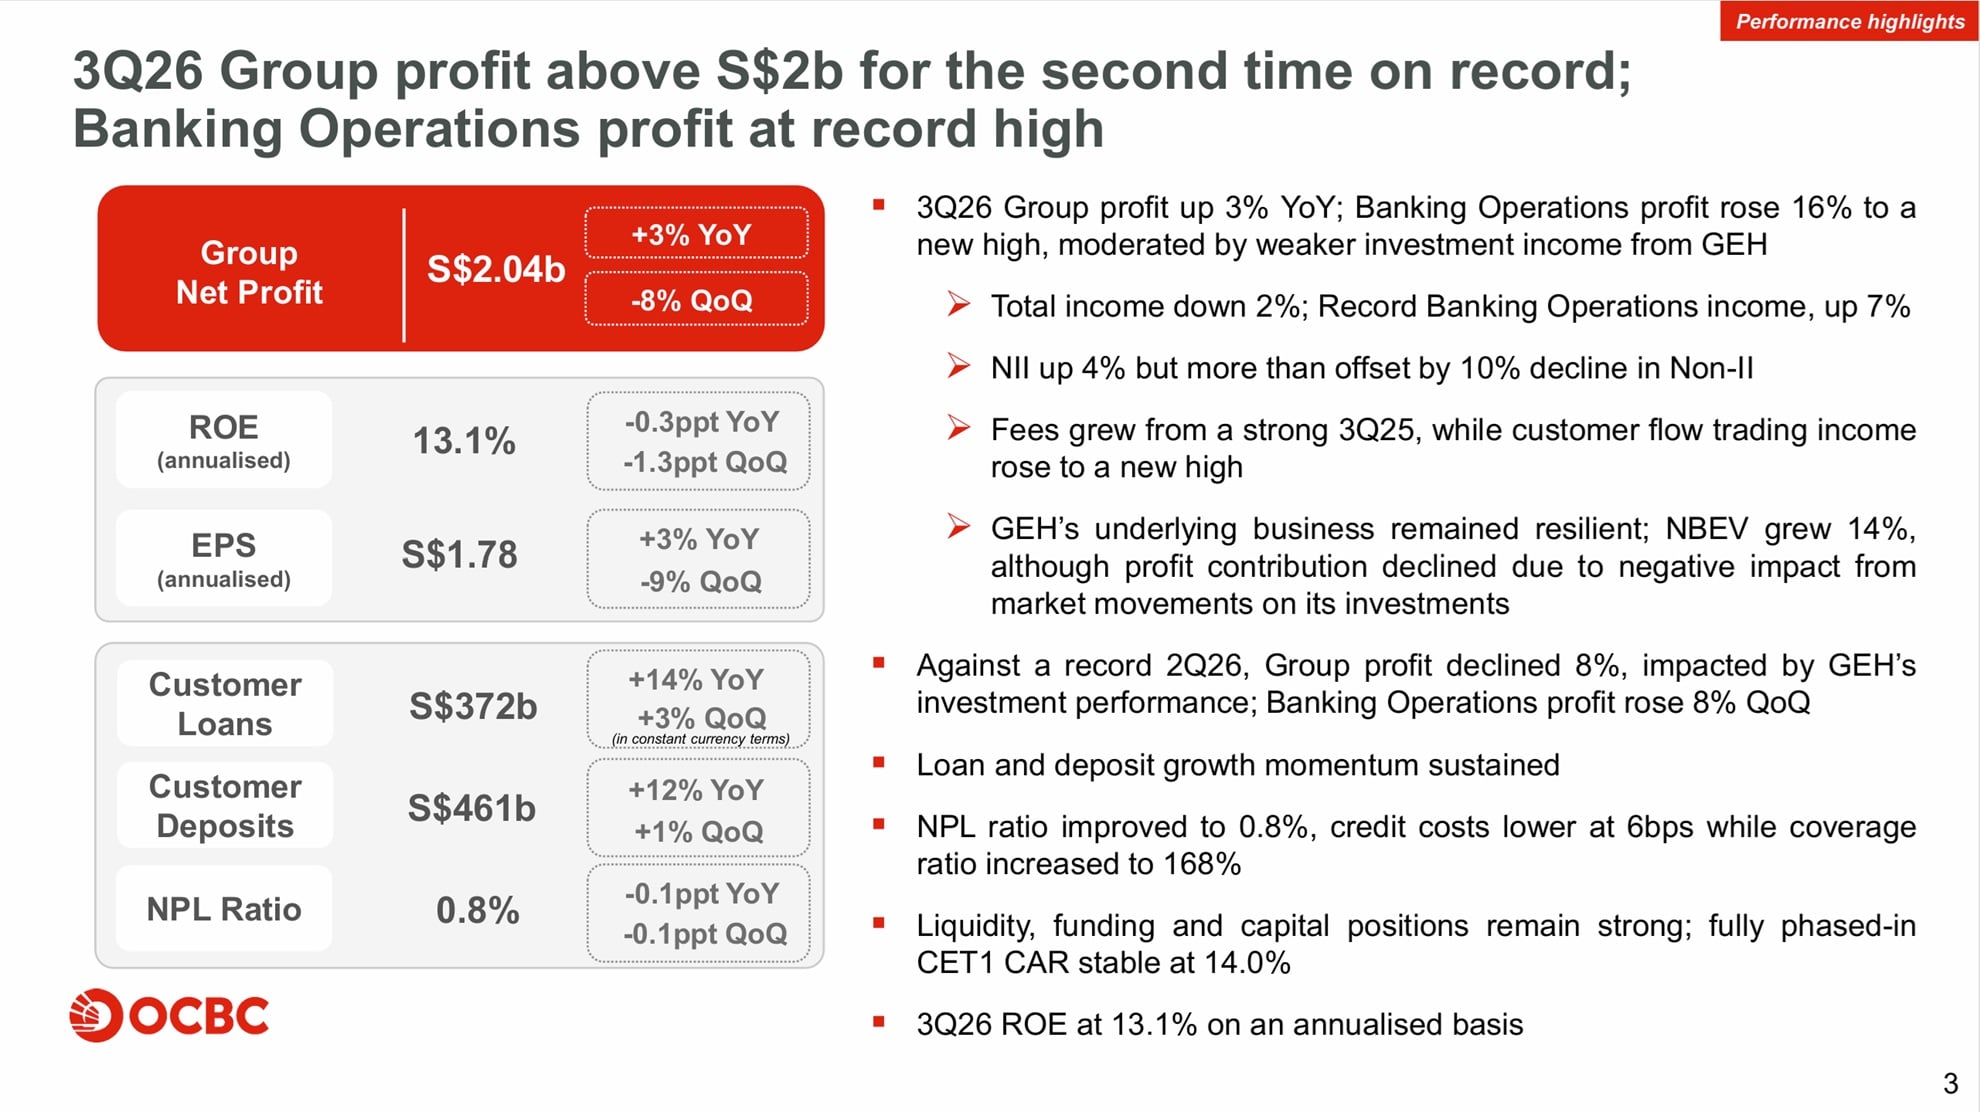
OCBC reported group net profit of S$2.04 billion for the third quarter of 2026. That is 3% higher than the same quarter a year ago, but 8% lower than the record second quarter of 2026. This is only the second time in the bank’s history that quarterly group profit has crossed the S$2 billion mark, and it came in above the third quarter of 2025, which had been the strongest quarter of last year.
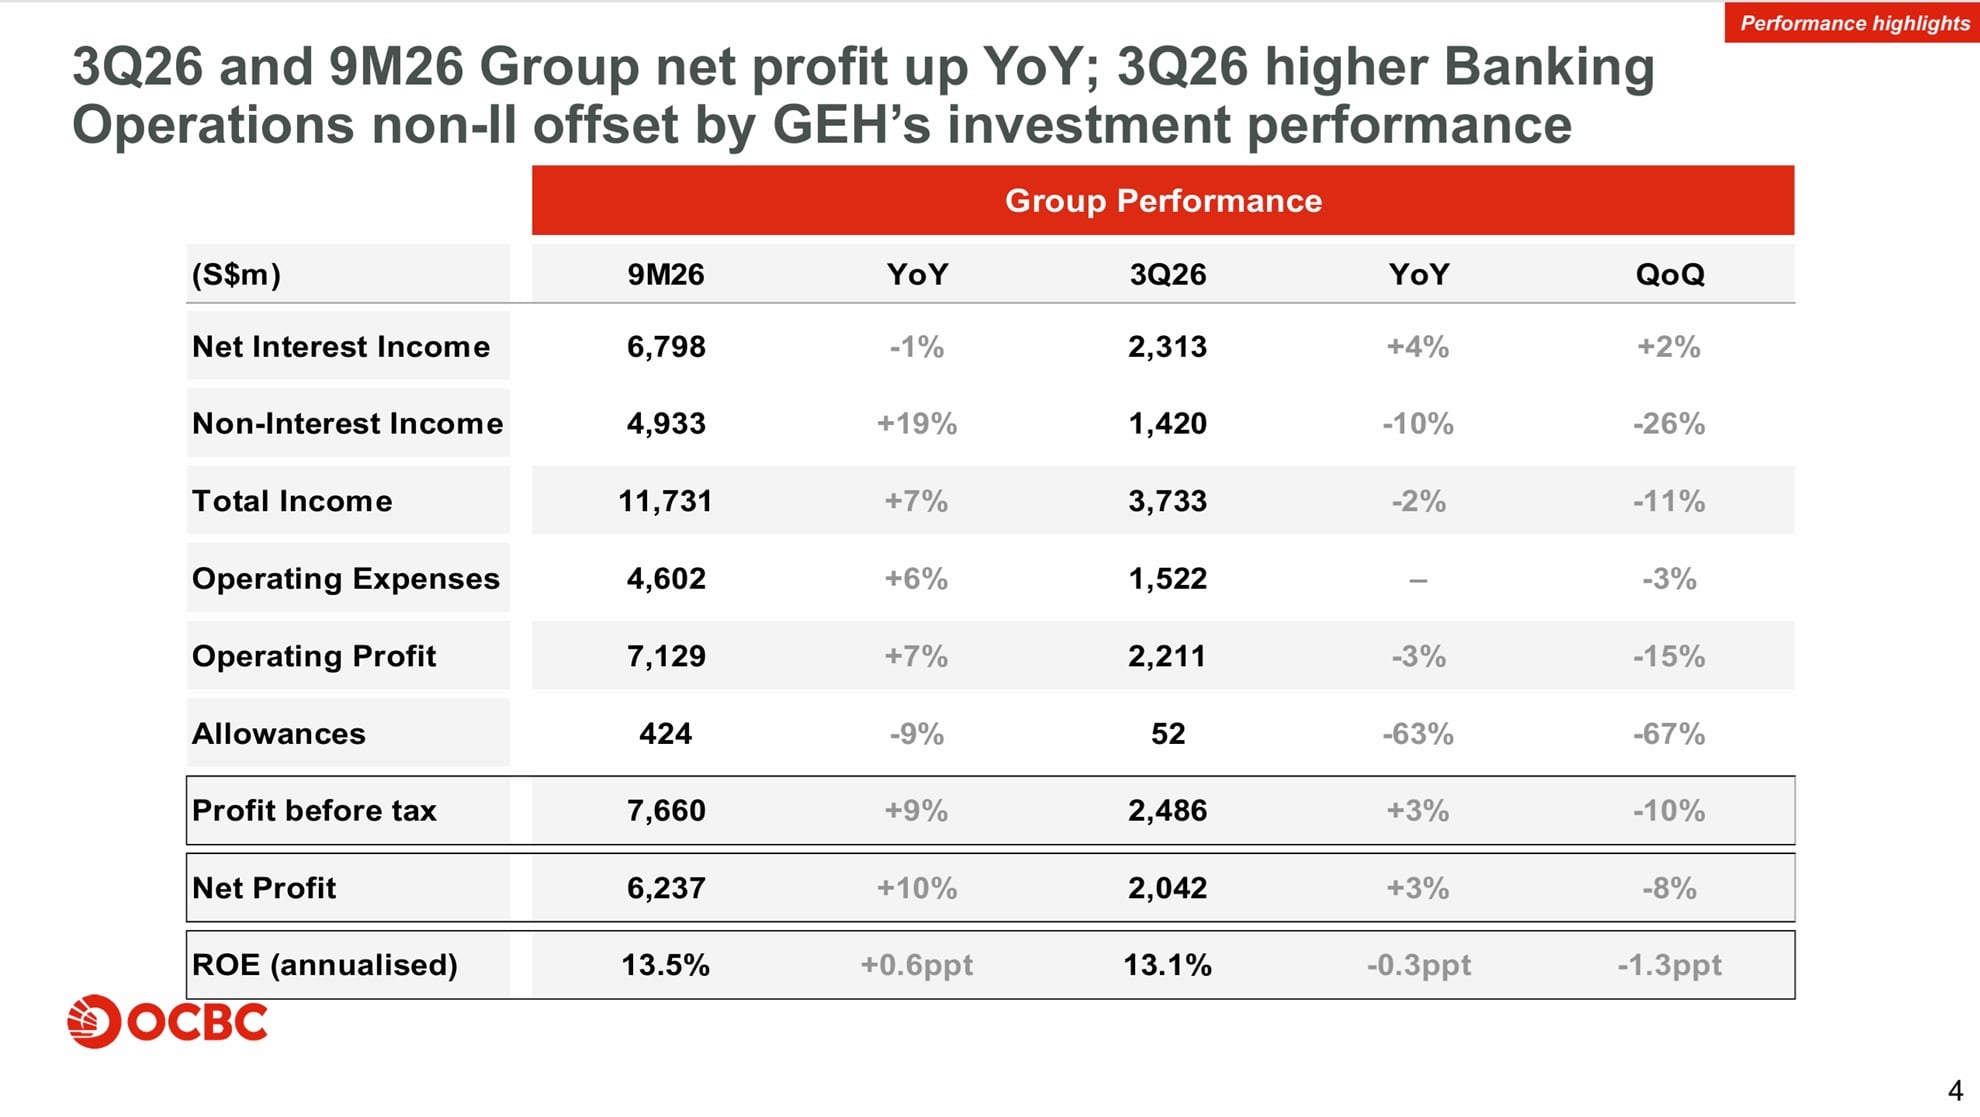
For the first nine months of 2026, group net profit climbed 10% to a record S$6.24 billion. Total income for the nine months also reached a new high of S$11.73 billion, up 7% from a year ago.
The most important takeaway for me from the OCBC Third Quarter 2026 Financial Results is the split between the banking business and the insurance business. Profit from banking operations rose to a record S$1.90 billion in the third quarter, up 16% year on year and 8% quarter on quarter. The drag on group profit came almost entirely from Great Eastern, where rising interest rates caused mark-to-market losses on its bond holdings.
Net Interest Income Reached a Six-Quarter High
Net interest income is the money a bank earns from lending after paying interest to depositors. For the third quarter of 2026, OCBC’s net interest income rose 4% year on year and 2% quarter on quarter to S$2.31 billion, which is the highest level in six quarters.
The growth came from a bigger balance sheet rather than better margins. Average assets grew 15% compared with a year ago. The net interest margin, which measures how much the bank earns on each dollar of interest-earning assets, slipped to 1.66%. That is 18 basis points lower than a year ago and 4 basis points lower than the previous quarter.
The interest rate story here is interesting. Higher Singapore Overnight Rate Average (SORA) rates actually helped, because OCBC’s asset yields rose faster than its funding costs in Singapore dollars. The opposite happened with United States dollar rates. When United States rates went up, OCBC’s funding costs repriced faster than its assets, which squeezed margins this quarter. Management expects the benefits of higher United States rates to show up in the coming quarters as loans and other assets reprice upwards.
For the full nine months, net interest income was S$6.80 billion, down a slight 1% from a year ago, with the net interest margin falling from 1.93% to 1.71%. In my view, holding net interest income almost flat while margins fell by more than 20 basis points is a solid result, and it shows how much the loan book has grown.
Strong Loan and Deposit Growth
Customer loans stood at S$372 billion as at 30 September 2026. In constant currency terms, loans grew 14% from a year ago and 3% from the previous quarter. The growth was spread across geographies and industries. OCBC highlighted high-growth sectors such as technology, media and telecommunications, digital infrastructure, transportation, and power and utilities, as well as real estate in developed markets. On the consumer side, wealth-related lending and Singapore mortgages also contributed.
Sustainable financing loans rose 13% to S$62.0 billion and now account for about 17% of total customer loans.
Customer deposits grew 12% year on year to S$461 billion, driven by both current and savings accounts and fixed deposits. The current account and savings account ratio, which measures the share of low-cost deposits, eased to 48.4% from 50.3% a year ago. A lower ratio usually means slightly higher funding costs, since fixed deposits pay more interest. The loans-to-deposits ratio edged up to 79.5%, which still leaves OCBC with comfortable room to keep lending.
Non-Interest Income: Banking Strength, Insurance Weakness
Non-interest income for the third quarter of 2026 was S$1.42 billion, down 10% year on year and 26% quarter on quarter. On the surface, that looks worrying. Underneath, the picture is much better than the headline number suggests.
Net fees and commissions rose 8% year on year to S$735 million, which was close to the record level in the second quarter. The growth was broad-based, coming from wealth management, loan and trade-related fees, and investment banking activities.
Customer flow trading income, which comes from clients buying hedging and treasury products from the bank, rose to an all-time high of S$480 million. This was a 29% jump from a year ago, with corporates being a key driver. Non-interest income from banking operations alone grew 13% year on year.
The weak spots were overall trading income and insurance income. Total trading income fell 33% quarter on quarter, and income from life and general insurance dropped 48% to S$198 million. Both declines were mainly caused by Great Eastern. When interest rates rise, bond prices fall, and Great Eastern recorded mark-to-market losses on bonds in its shareholders’ fund. On top of that, the second quarter had included sizeable gains on Great Eastern’s equity portfolio that did not repeat in the third quarter.
For the nine months, the story is much more positive. Non-interest income grew 19% to a record S$4.93 billion and now makes up 42% of total income, up from 38% a year ago. Net fee income rose 19% to S$2.15 billion, wealth management fees jumped 25% to a record S$1.33 billion, and customer flow trading income surged 40% to a record S$1.35 billion.
Wealth Management Remains a Key Growth Engine
OCBC’s wealth management franchise continues to be one of the main reasons I like this bank. Banking wealth management assets under management grew 7% year on year and 2% quarter on quarter to a new high of S$358 billion. The bank reported continued net new money inflows across all its wealth segments, from premier banking to private banking.
Excluding Great Eastern, banking wealth management income rose 2% quarter on quarter to a record S$1.12 billion. Including Great Eastern, group wealth management income fell 25% from the previous quarter because of the insurance investment losses.
Wealth fees made up 62% of total fee income for the nine months. Fee income like this does not require the bank to put much capital at risk, and it is less sensitive to interest rate movements than lending income. As interest rates shift up and down, a large and growing wealth business gives OCBC a steadier source of earnings.
Great Eastern: Weak Investment Results, Resilient Underlying Business
Great Eastern had a difficult third quarter on the investment side, but its underlying insurance business held up well. New business embedded value, which estimates the future profits from new policies sold, grew 14% year on year. Management credited growth of more than 20% in its agency and bancassurance channels in Singapore. The new business embedded value margin improved to 57.5% from 51.0% in the previous quarter, thanks to a more favourable product mix.
Over the nine months, Great Eastern’s profit contribution to the group still rose 5% to S$941 million. Total weighted new sales grew 9% and new business embedded value grew 23%, with the margin widening to 52.2% from 46.1% a year ago.
I see the Great Eastern weakness as largely a timing issue tied to market movements rather than a problem with the business itself. Mark-to-market losses on bonds can reverse if interest rates stabilise or fall. That said, insurance investment income is naturally volatile, and investors should expect it to cause bumps in OCBC’s quarterly profit from time to time.
Costs Were Well Controlled
Operating expenses for the third quarter were S$1.52 billion, unchanged from a year ago and 3% lower than the previous quarter. Because total income fell more than expenses did, the cost-to-income ratio rose to 40.8% from 37.8% in the second quarter.
For the nine months, operating expenses rose 6% to S$4.60 billion, mainly from higher variable pay in line with stronger income, as well as increased technology and promotional spending. The nine-month cost-to-income ratio was 39.2%, which is a very efficient level for a bank of OCBC’s size.
Asset Quality Improved Further
OCBC’s asset quality continued to look healthy. Non-performing assets fell 3% quarter on quarter to S$3.04 billion, as recoveries and upgrades more than offset new problem loans. The non-performing loan ratio improved to 0.8%, from 0.9% a year ago.
Total allowances for the third quarter were only S$52 million, down sharply from S$139 million a year ago and S$156 million in the previous quarter. This brought annualised credit costs down to just 6 basis points. For the nine months, credit costs were 14 basis points compared with 17 basis points a year ago.
The bank also kept a healthy buffer against future losses. Total coverage of non-performing assets rose to 168%, up from 160% a year ago. A large part of the S$234 million of allowances for non-impaired assets this year was set aside in the first half as overlays for macroeconomic uncertainty, including the conflict in the Middle East and conditions in Indonesia. I covered the Middle East risk in more detail in my post on how the Iran conflict could affect OCBC’s share price.
Capital Position Remains Strong
OCBC’s Common Equity Tier 1 capital adequacy ratio was 15.5% under the transitional final Basel III rules and 14.0% on a fully phased-in basis. The fully phased-in ratio was unchanged from the previous quarter, as profits and balance sheet management initiatives offset the impact of asset growth and dividend payments.
OCBC has set a target operating range of about 14% for this ratio on a fully phased-in basis. Sitting right at that level means the bank has enough capital to support loan growth, but the room for very large special payouts beyond the current plans may be more limited. Management did say there is scope for further progress on capital efficiency.
Management Upgraded Its 2026 Guidance
One of the more encouraging parts of the OCBC Third Quarter 2026 Financial Results was a further upgrade to financial guidance for the full year 2026. Here is a summary of what management now expects.
Loan growth is expected to be in the low double digits. Total income is expected to grow by at least a mid-single-digit percentage, while net interest income is expected to be flat or slightly lower. The cost-to-income ratio is guided at around the low 40% range, and credit costs are expected to be between 15 and 20 basis points.
On shareholder returns, OCBC reaffirmed its 50% ordinary dividend payout ratio and its plan to complete the S$2.5 billion capital return programme by the end of financial year 2026.
These assumptions are based on a three-month SORA averaging about 1.2% for the year, one more United States Federal Reserve rate hike in the fourth quarter of 2026, and a three-month Hong Kong Interbank Offered Rate of about 2.9%. Management also said the bank is well positioned for higher interest rates.
OCBC Share Price Valuation at S$27.73
Using the closing price of S$27.73 on 6 November 2026, here is how I see OCBC’s valuation based on the figures in the results.
Looking at the OCBC Third Quarter 2026 Financial Results from a valuation angle, net asset value per share was S$13.55 as at 30 September 2026. This puts OCBC at a price-to-book ratio of about 2.05 times. That is a significant premium to book value, reflecting the market’s confidence in OCBC’s return on equity, which was 13.5% on an annualised basis for the nine months.
Annualised earnings per share for the nine months was S$1.83. At S$27.73, this works out to a price-to-earnings ratio of about 15.2 times.
If I apply the 50% ordinary payout ratio to annualised earnings per share of S$1.83, the implied ordinary dividend is about S$0.92 per share. That translates to an ordinary dividend yield of roughly 3.3% at the current share price. This is my own estimate, not a figure announced by OCBC. Any additional payout under the capital return plan would add to the total yield.
The share price has rallied strongly this year, which has pushed the dividend yield lower. If you are comparing OCBC with its peers, my post on DBS vs UOB vs OCBC may be helpful.
Risks to Watch
Management pointed to several risks. Global conditions remain uncertain because of geopolitical tensions and elevated inflation. The near-term outlook depends a lot on whether energy prices ease, which is closely tied to the war in the Middle East. OCBC is also monitoring market conditions in Indonesia, where it has a meaningful banking presence.
Interest rates are a double-edged sword. Rising United States rates pressured margins this quarter and caused investment losses at Great Eastern. Management expects asset repricing to help net interest income in coming quarters, but if rates move in an unexpected direction, results could again be volatile.
On the positive side, OCBC noted that artificial intelligence and related technology sectors are still growing strongly. Many of the high-growth sectors driving loan growth, such as digital infrastructure and power, are linked to this trend.
My Thoughts as an OCBC Shareholder
Overall, I am pleased with the OCBC Third Quarter 2026 Financial Results. The headline drop from the previous quarter came almost entirely from Great Eastern’s investment performance, which I see as market noise rather than a structural problem. The core bank delivered record profit, record customer flow trading income, steady fee income, strong loan growth and improving asset quality.
What gives me the most confidence is the upgrade in full-year guidance. Management raising expectations in a year marked by geopolitical uncertainty and shifting interest rates tells me the franchise is in good shape.
The main thing that holds me back from adding more right now is valuation. At around two times book value and a dividend yield of roughly 3.3% on ordinary dividends, OCBC is no longer cheap compared with where it traded a few years ago. With OCBC already making up 4.68% of my portfolio, I am comfortable holding my position and collecting dividends, and I would consider adding only on a meaningful pullback.
My Thoughts on OCBC Third Quarter 2026 Financial Results
The OCBC Third Quarter 2026 Financial Results show a bank with a strong and diversified banking franchise. Group net profit of S$2.04 billion was up 3% year on year, nine-month profit hit a record S$6.24 billion, and banking operations profit reached a new high. Great Eastern’s investment losses weighed on the quarter, but its underlying insurance business stayed resilient. With healthy asset quality, solid capital, upgraded 2026 guidance and a committed 50% dividend payout ratio, I continue to see OCBC as a core holding for long-term dividend investors in Singapore.
For the full official documents, you can visit the investor relations section of the OCBC website.
Disclaimer: This post reflects my personal views and is not financial advice. Please do your own research before making any investment decision.