On 23rd July 2025, OUE REIT announced their 1H2025 financial results. OUE REIT makes up only 1.92% of my stock portfolio. I have been hoping for the divestment of its China assets as it has been non-performing. Lippo Plaza Shanghai was divested in December 2024. With no more assets in China, how is OUE REIT’s performance? What is OUE REIT share price? What is OUE REIT dividend yield? These are questions on my mind right now.
As this point of writing, OUE REIT’s portfolio comprised of six high-quality office, hospitality and retail assets located in Singapore. The three office assets are OUE Bayfront, One Raffles Place and OUE Downtown Office. OUE REIT’s two hotels, Hilton Singapore Orchard and Crowne Plaza Changi Airport, are strategically located along the prime Orchard Road belt and within the Changi Airport vicinity.
According to CBRE, Core Central Business District (“CBD”) rents recorded a second consecutive quarter of rental growth. Singapore visitor arrivals growth moderated to 1.9% year-on-year, reaching 8.3 million from January to June 2025, reflecting a normalisation in post-pandemic travel recovery.
With such positive economic factors, are you wondering how the assets in OUE REIT are performing? Now, let us take a look at OUE REIT 1H2025 financial results to check on its performance.
1H2025 Financial Results
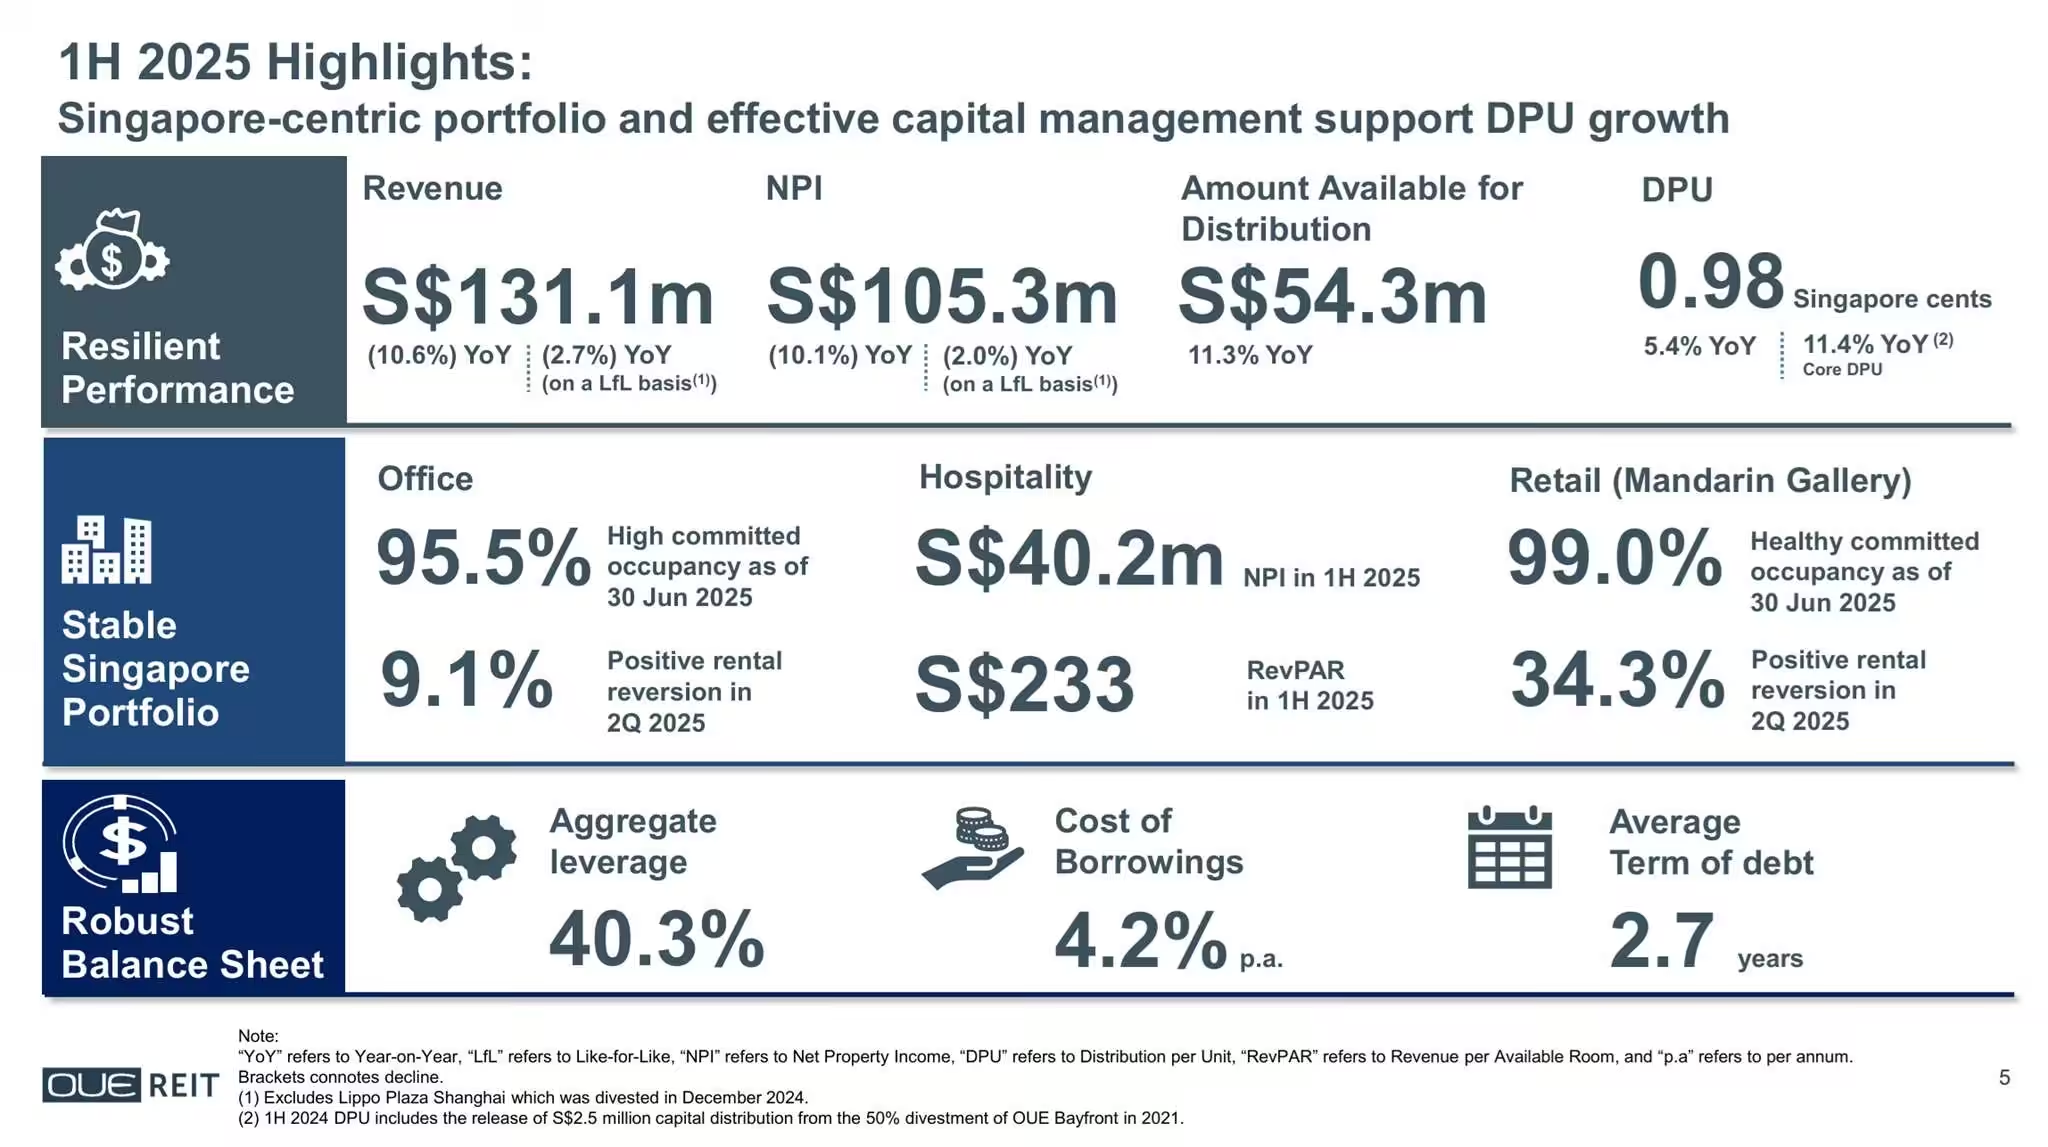
In 1H2025, OUE REIT’s Gross Revenue and Net Property Income (NPI) declined 10.6% and 10.1% respectively. If we exclude Lippo Plaza Shanghai which was divested in December 2024, the like-for-like Gross Revenue and Net Property Income (NPI) declined by 2.7% and 2.0% respectively.
Finance costs declined significantly by 17.3% year-on-year. Overnight Rate Average (“SORA”) had enabled OUE REIT to significantly reduce financing costs and support DPU growth.
A distribution per unit (DPU) of 0.98 cents was declared, representing 5.4% increase year-on-year.
| 1H2025 (S$’000) |
1H2024 (S$’000) |
% Change | |
| Gross Revenue | 131,114 | 146,729 | (10.6) |
| Net Property Income | 105,338 | 117,143 | (10.1) |
| Finance Costs |
(45,267) | (54,742) | (17.3) |
| Amount Available for Distribution | 54,310 | 48,799 | 11.3 |
| Distribution Per Unit (“DPU”) (cents) | 0.98 | 0.93 | 5.4 |
Debt

Aggregate Leverage also known as the gearing ratio is a financial metric that shows how much debt a company or investment trust (like a REIT) is using relative to its total assets. As of 30th June 2025, OUE REIT’s aggregate leverage stood high at 40.3%.
The weighted average term of debt remained healthy at 2.7 years. OUE REIT was given a credit rating of “BBB-” by S&P with Stable Outlook. Assuming the net proceeds from the divestment of Lippo Plaza are fully utilised to repay loans, the aggregate leverage is expected to decline to 37.2%.
71.1% of OUE REIT’s total debt were hedged into fixed rates and weighted average cost of debt was 4.2% per annum.
As you can see from the chart above, OUE REIT has a well-spread debt maturity profile. With the post-refinancing of OUE Allianz Bayfront LLP’s loan, OUE REIT will not have more than 23.0% of debt due in any year.
Having a well-staggered debt maturity profile is crucial for OUE REIT to manage its debt obligations effectively. By spreading out debt repayments over different time periods, OUE REIT can avoid liquidity crunches and reduce the risk of default.
Occupancy
As of 30th June 2025, OUE REIT’s Singapore office portfolio committed occupancy stood at 95.5%. Average passing rent increasing by 0.8% quarter-on-quarter to S$10.86 per square foot per
month. Positive rental reversion remained strong at 9.1% for office lease renewals in the second
quarter of 2025.
In terms of the occupancy for retail segment, Mandarin Gallery’s committed occupancy remained high at 99.0%. Mandarin Gallery recorded another quarter of high rental reversion of 34.3% in 2Q
2025. Average passing rent rose by 2.7% QoQ to S$22.22 per square foot per month.
RevPAR (Revenue Per Available Room)
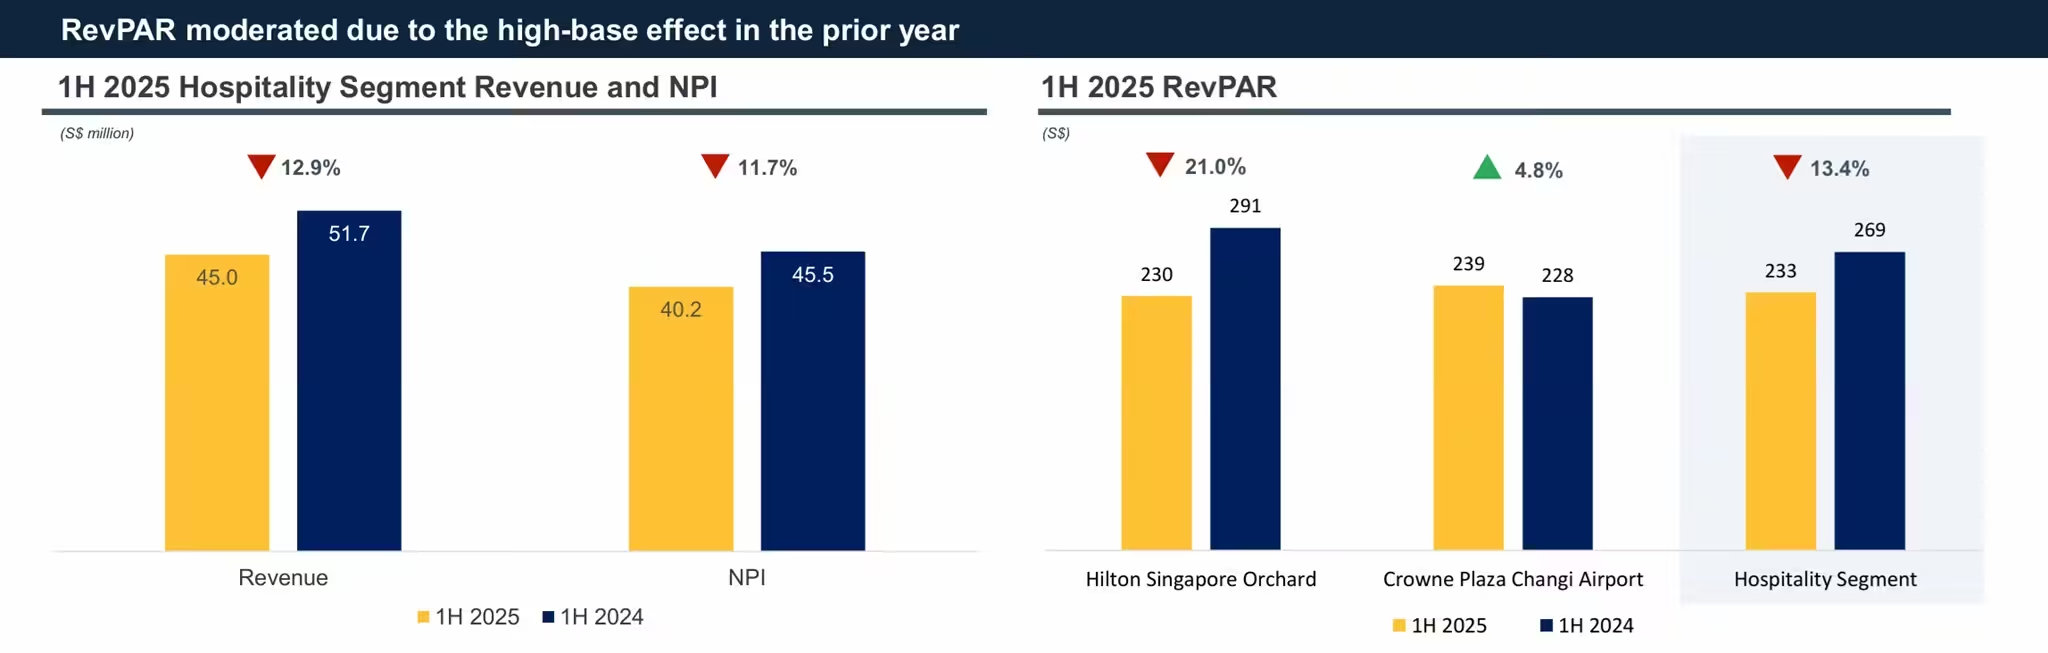
RevPAR stands for Revenue Per Available Room. It is a key performance metric in the hospitality industry used to measure a hotel’s ability to fill rooms at an average rate. In 1H2025, OUE REIT’s hospitality segment’s revenue per available room (“RevPAR”) stood at S$233.
Crowne Plaza Changi Airport’s RevPAR rose by 4.8% year-on-year, reaching S$239. Hilton Singapore Orchard’s RevPAR moderated to S$230 in 1H 2025, due to a normalisation of room rates and occupancy following last year’s high base, as well as increased hotel room supply in Singapore’s central area.
OUE REIT Share Price and Dividend Yield
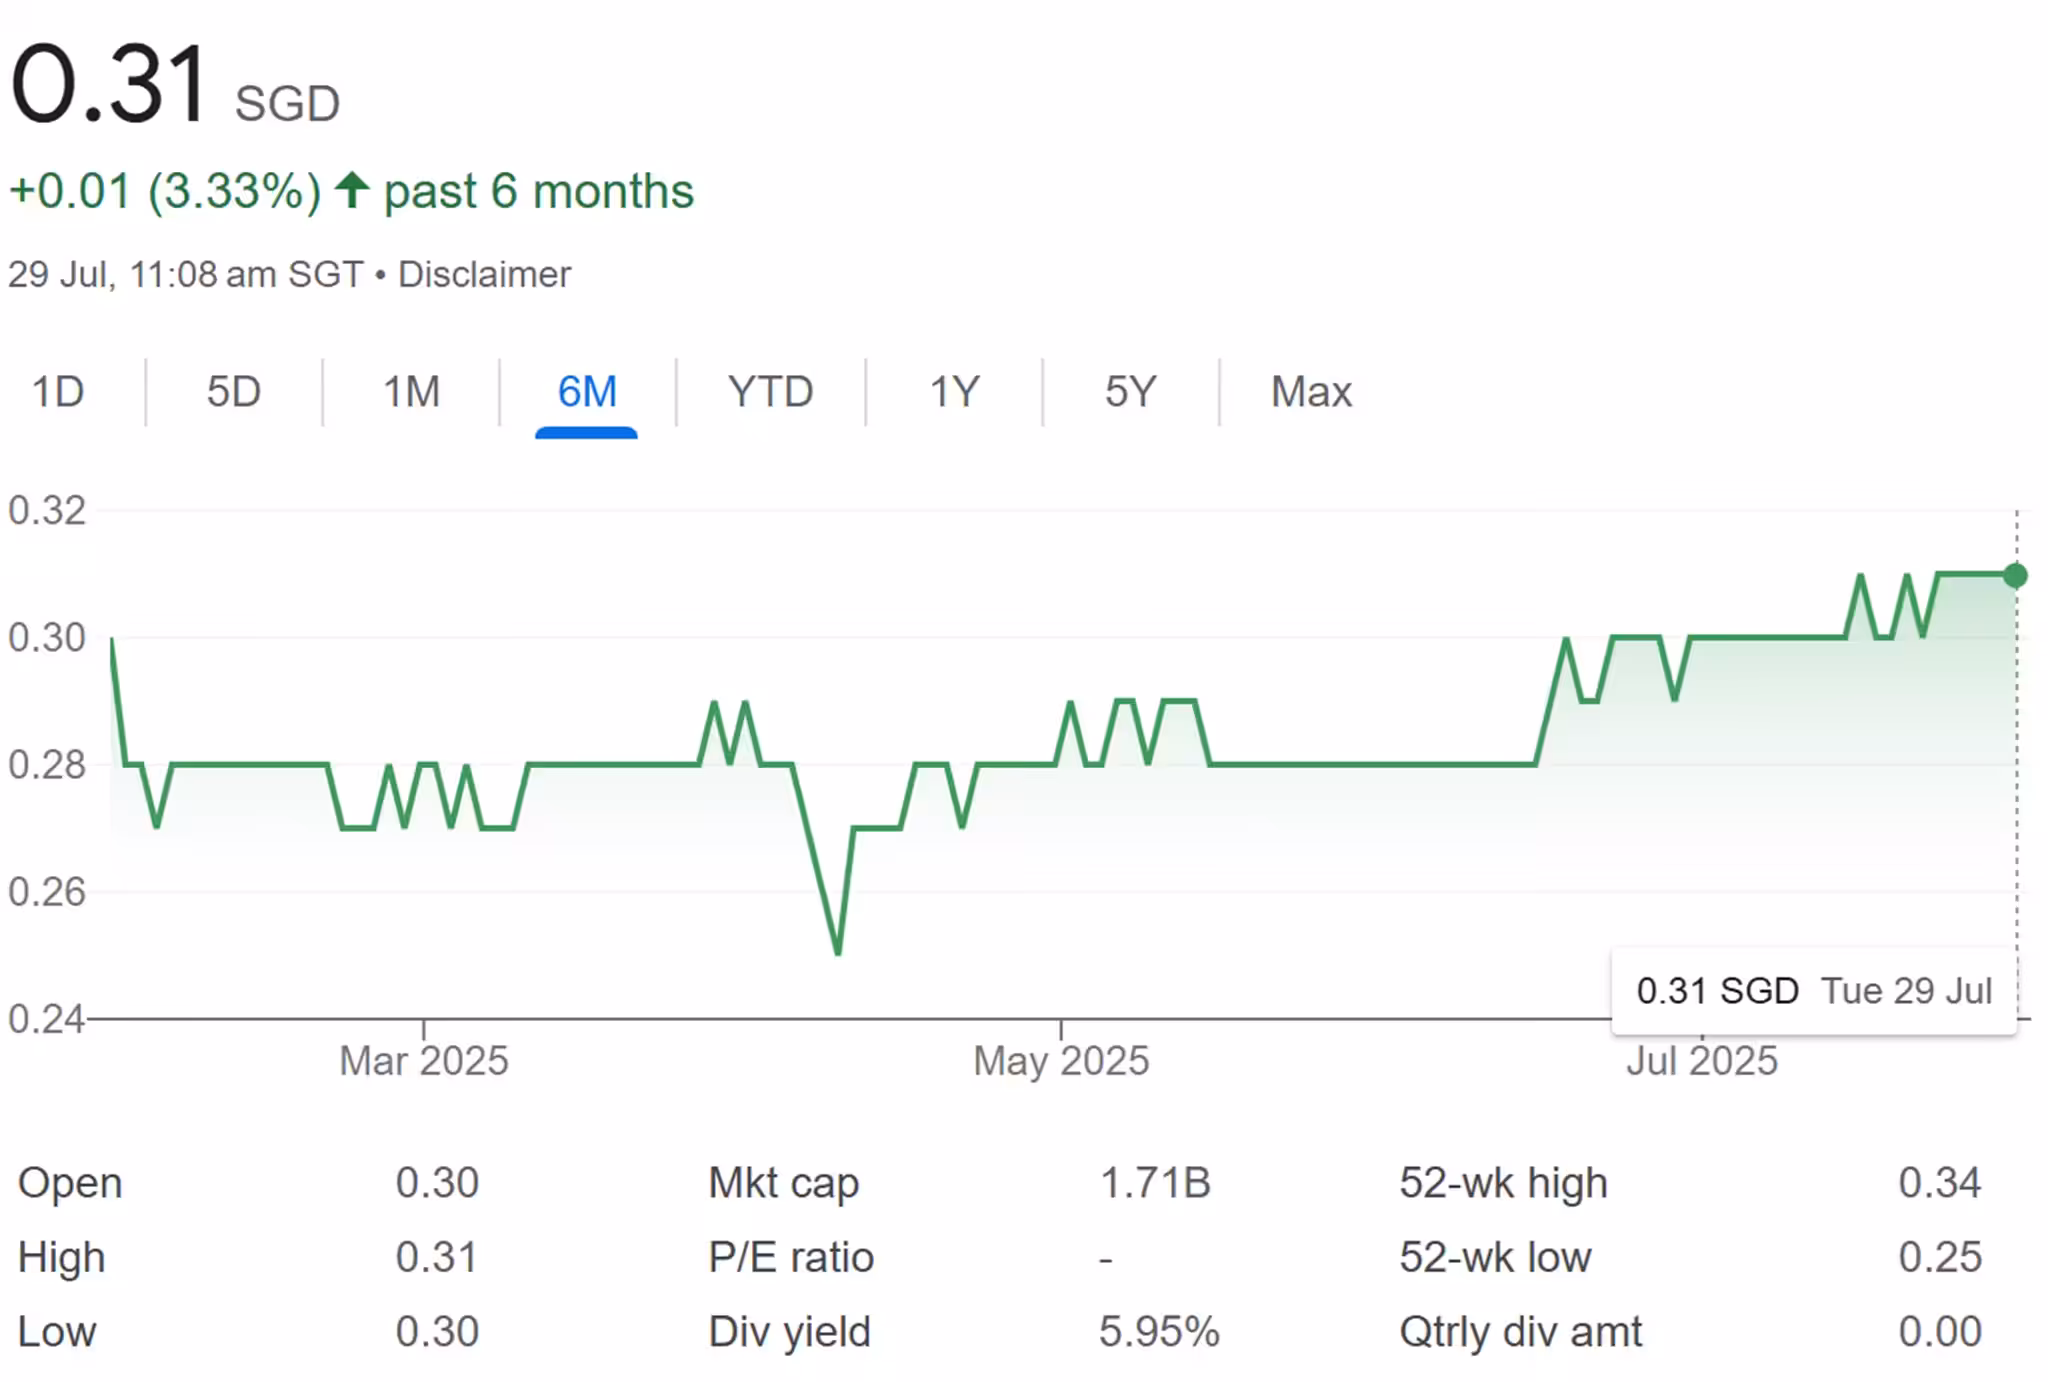
At this point of writing, OUE REIT’s share price stood at S$0.31. Based on FY24 full year distribution of 2.06 cents, OUE REIT dividend yield is 6.65%.
Summary of OUE REIT 1H2025 Financial Results
As usual, let me summarize the pros and cons based on OUE REIT 1H2025 financial results. The pros are:
- 71.1% of total debt were hedged into fixed rates.
- Well-spread debt maturity profile.
- Office portfolio committed occupancy stood at 95.5%. Average passing rent increasing by 0.8% quarter-on-quarter.
- Mandarin Gallery’s committed occupancy remained high at 99.0%. High rental reversion of 34.3% in 2Q2025.
- Crowne Plaza Changi Airport’s RevPAR rose by 4.8% year-on-year, reaching S$239.
- High dividend yield of 6.65%.
The cons are:
- Gross Revenue and Net Property Income (NPI) declined 10.6% and 10.1% respectively.
- Aggregate leverage stood high at 40.3%.
Overall, OUE REIT seems to be on track for recovery. The only concern here will be its high gearing ratio. Hopefully, the manager can reduce its debt by using the proceeds from the divestment of Lippo Plaza Shanghai to pay it off.