On 5th February 2025, CICT (CapitaLand Integrated Commercial Trust) released their FY2024 financial results. As of January 2025, CICT makes up 9.50% of my stock portfolio. In fact, it is my largest holding in my stock portfolio. Last year, CICT acquired a 50.0% interest in ION Orchard for S$1,848.5 million. Recently, CICT also divested 21 Collyer Quay for S$688 million. As an existing unitholder, I am excited to know how CICT has performed in FY2024.
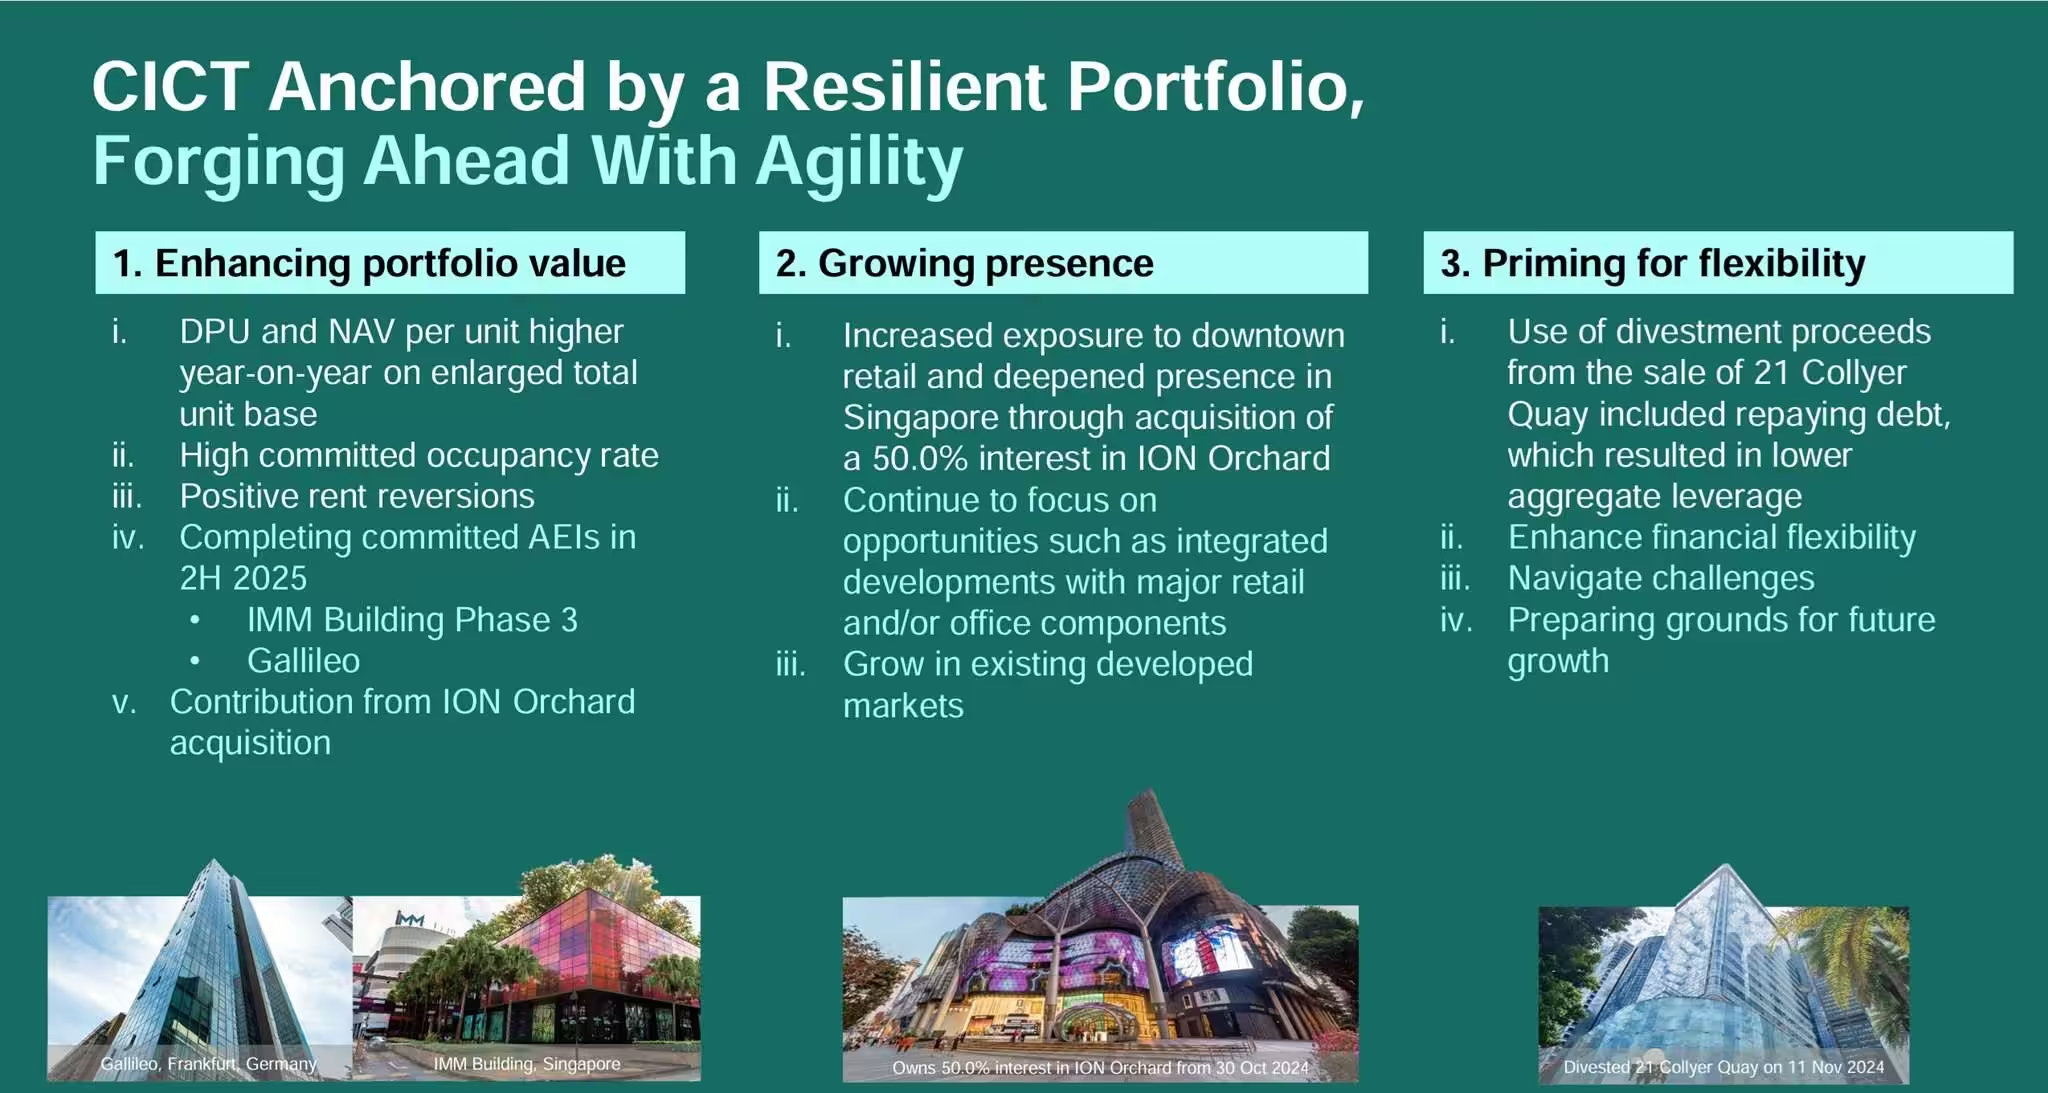
At of 31st December 2024, CICT’s portfolio comprises of 21 properties in Singapore, two properties in Frankfurt, Germany, and three properties in Sydney, Australia with a total property value of S$26.0 billion. IMM Building in Singapore and Gallileo in Germany are undergoing Asset Enhancement works and are on track for completion in 2H 2025.
A quality REIT is one that can grow its Distribution Per Unit (DPU) year-on-year. Can CICT grow its Distribution Per Unit year-on-year? Let us find out based on its full year financial results below.
CICT 2H2024 Financial Results
In 2H2024, CICT’s gross revenue grew 1.2% to S$794.4 million. The growth was driven by enhanced performance of the existing portfolio despite the absence of revenue from the divestment of 21 Collyer Quay. Income was also absence from CICT’s asset in Germany, Gallileo which has been undergoing an asset enhancement initiative since February 2024.
Distributable income grew 6.4% to S$385.7 million. According to the press release, the gain was mainly driven by the acquisition of a 50.0% interest in ION Orchard, better performance of its existing operating properties and being prudent in its operating and interest costs. This was partly offset by the divestment of 21 Collyer Quay.
Distribution Per Unit (DPU) remains flat at 5.45 cents.
| 2H2024 (S$’000) |
2H2023 (S$’000) |
Change (%) | |
| Gross Revenue | 794,368 | 785,157 | 1.2% |
| Net Property Income | 571,114 | 563,570 | 1.3% |
| Amount Available for Distribution |
390,888 | 369,503 | 5.8% |
| Distributable Income |
385,732 | 362,481 | 6.4% |
| Distribution Per Unit (“DPU”) (cents) | 5.45 | 5.45 | – |
CICT FY2024 Financial Results
In FY2024, CICT’s gross revenue grew 1.7% to S$1,586.3 million. Net property income (NPI) also grew 3.4% to S$1153.5 million.
On the back of better performance across its financial results, CICT achieved a Distribution Per Unit (DPU) of 10.88 cents which is 1.2% higher year-on-year.
| FY2024 (S$’000) |
FY2023 (S$’000) |
Change (%) | |
| Gross Revenue | 1,586,329 | 1,559,934 | 1.7% |
| Net Property Income | 1,153,478 | 1,115,907 | 3.4% |
| Amount Available for Distribution |
761,592 | 728,486 | 4.5% |
| Distributable Income |
752,211 | 715,726 | 5.1% |
| Distribution Per Unit (“DPU”) (cents) | 10.88 | 10.75 | 1.2% |
Debt
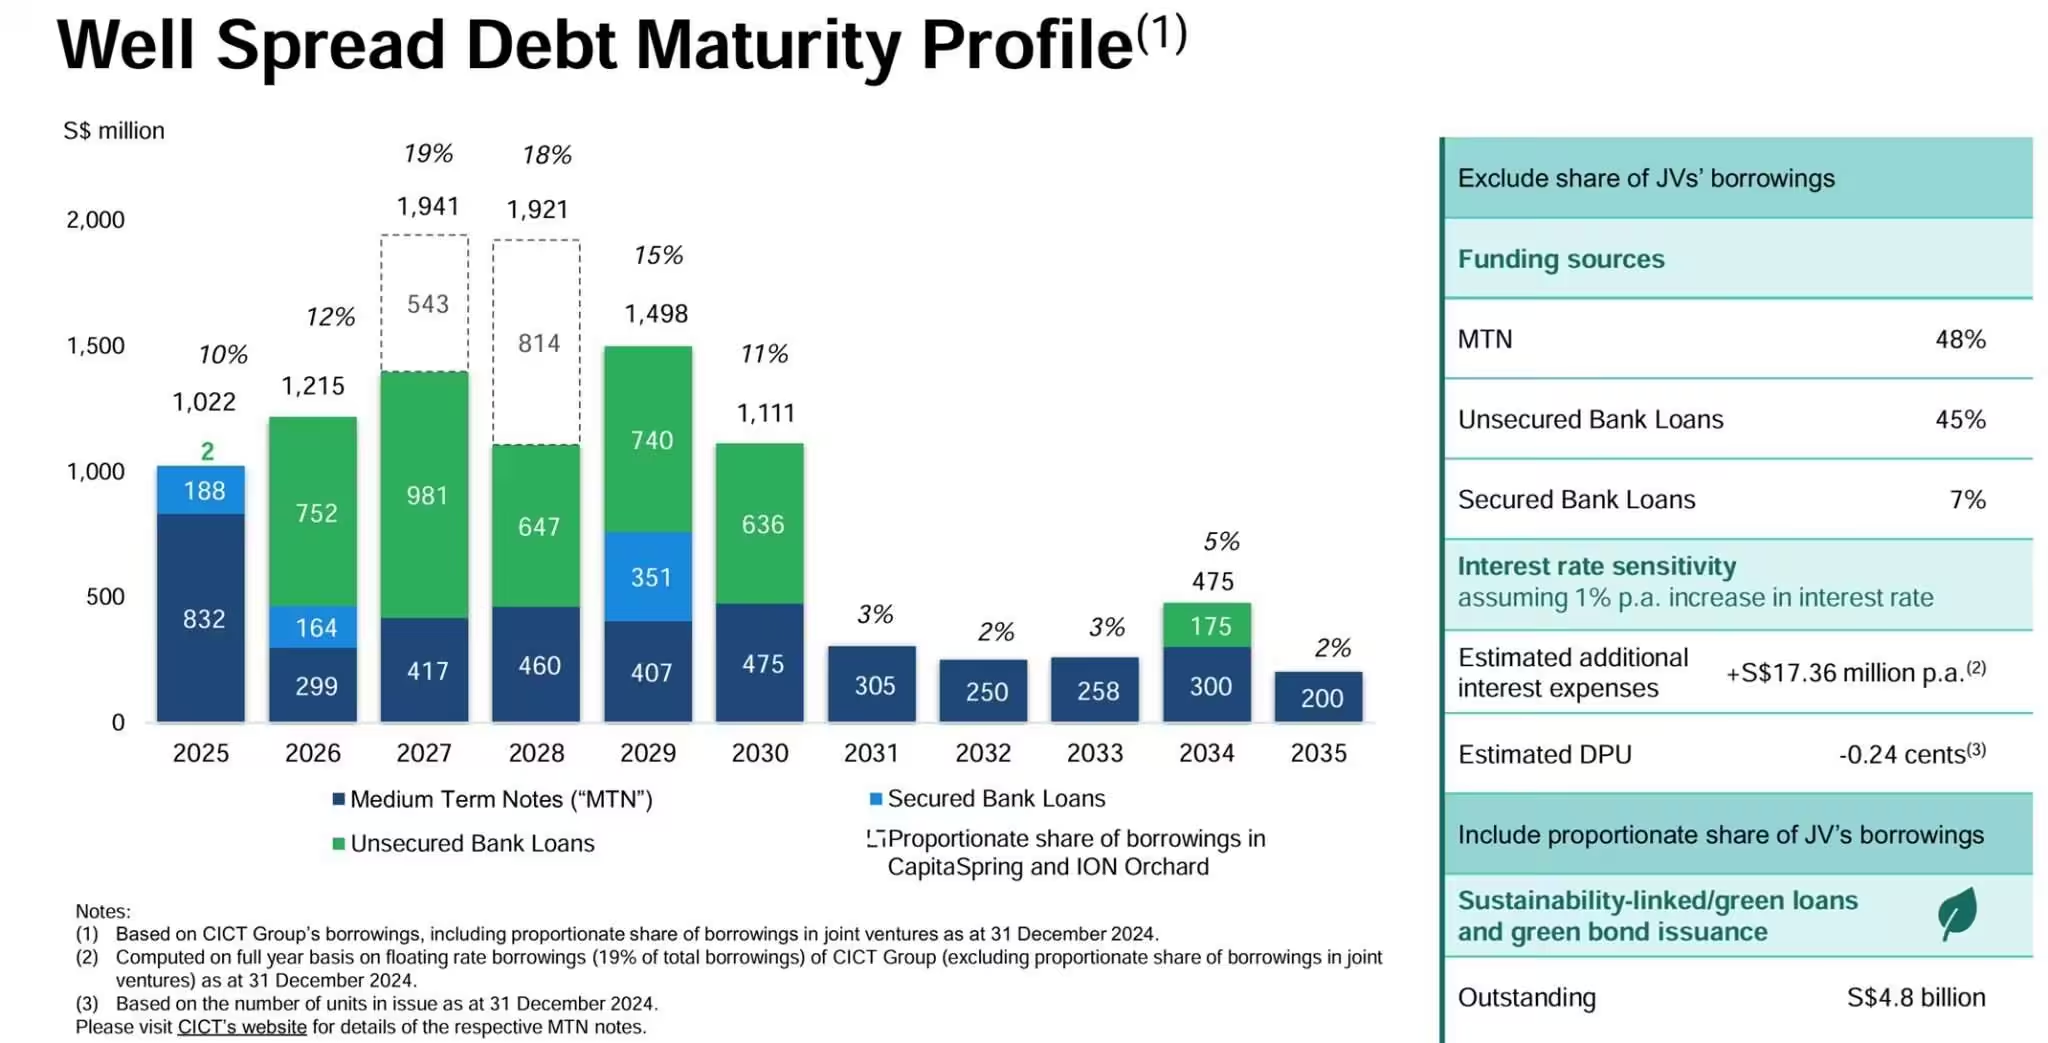
As 31st December 2024, CICT’s aggregate leverage stood healthy at 38.5%. I am glad the manager is able to lower its gearing from 39.4% in September to the current ratio of 38.5%. Aggregate Leverage is also known as “gearing” and is a financial ratio used to assess a company’s reliance on debt. CICT’s aggregate leverage indicates how much debt a REIT holds relative to its property value.
Average cost of debt remained at 3.6%, with 81% of its total borrowings on fixed interest rates. Debt maturity profile is well-staggered across various tenures.
Occupancy
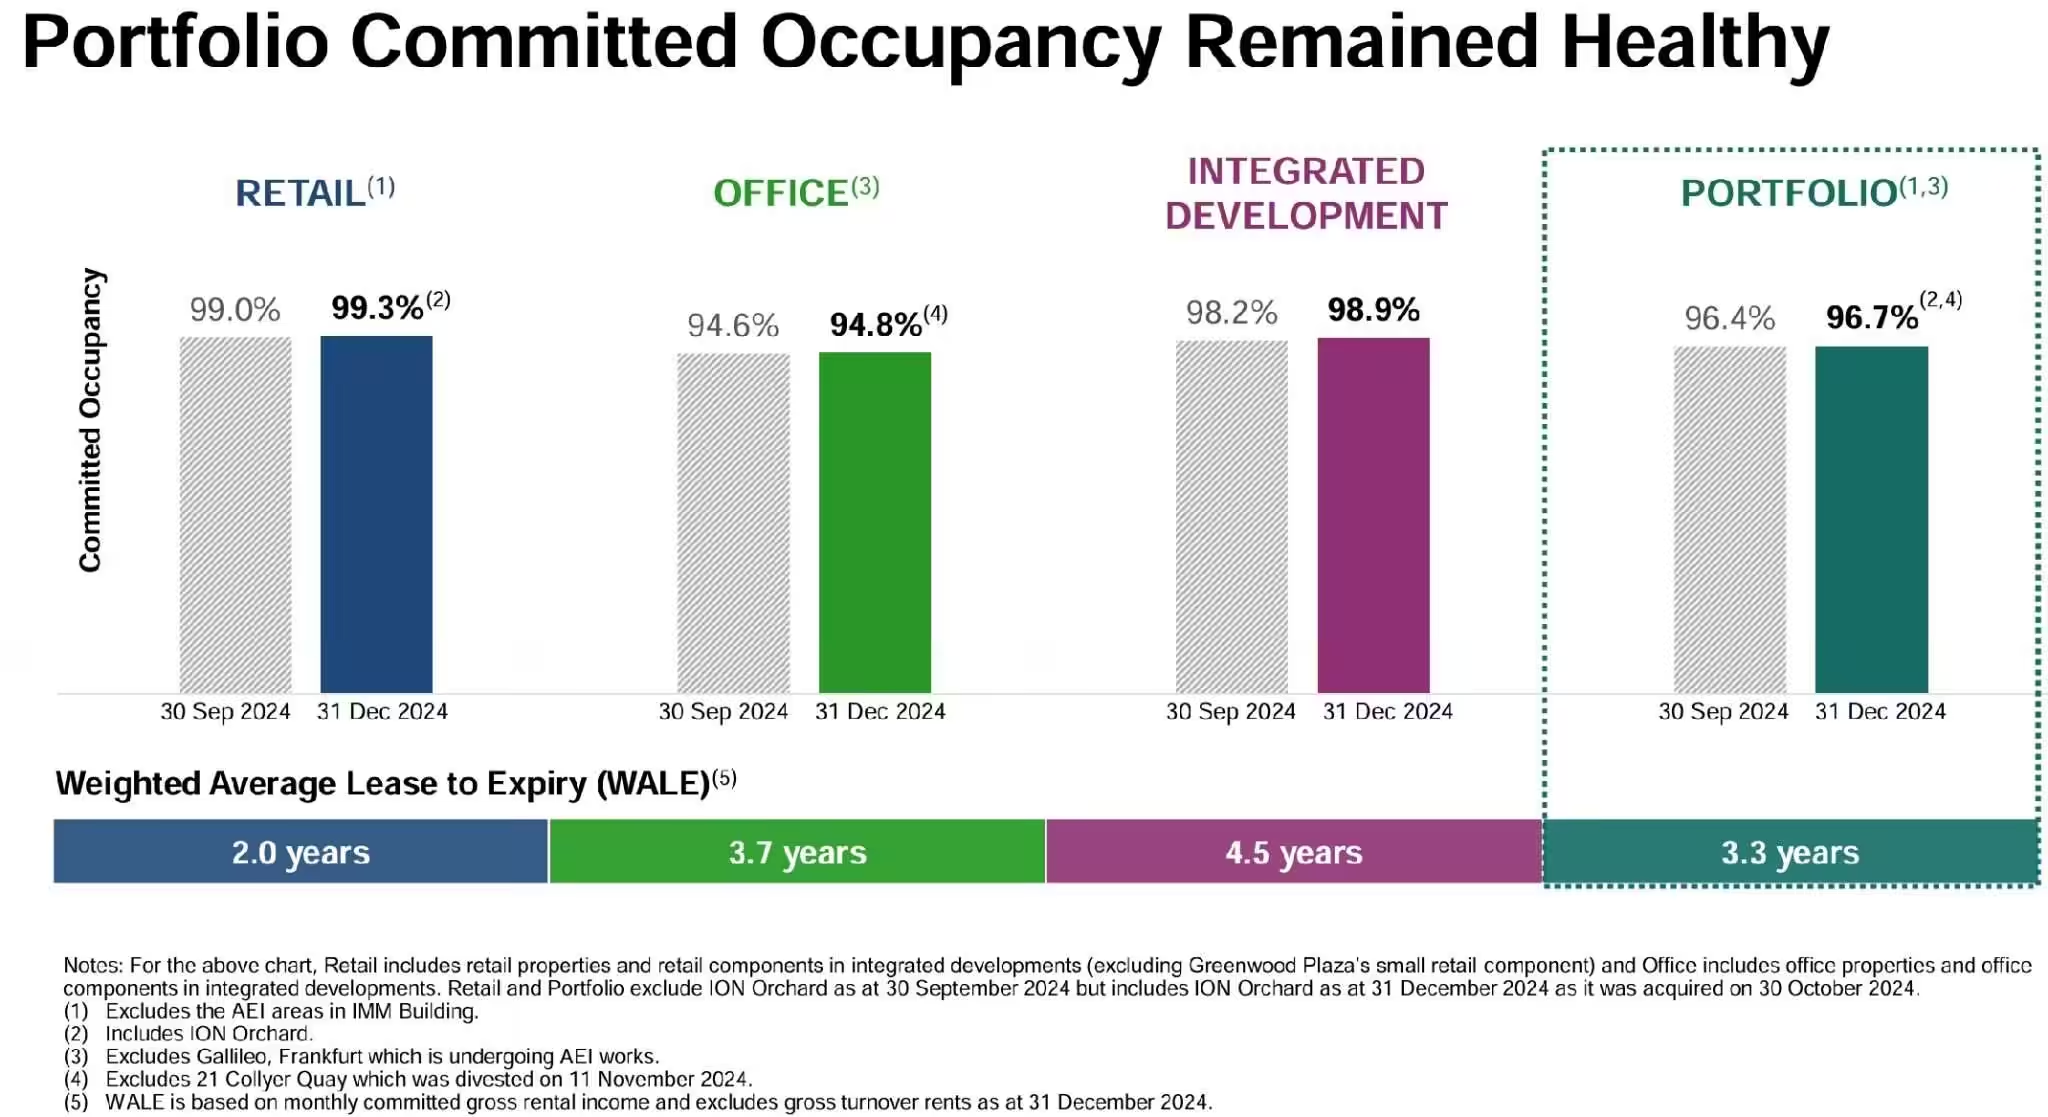
As of 31st December 2024, CICT’s portfolio achieved a high committed occupancy of 96.7%, with the respective retail and office portfolios recording 99.3% and 94.8% respectively while the integrated development portfolio also increased to 98.9%.
The Singapore retail and office portfolios achieved rent reversions of 8.8% and 11.1% respectively.

As you can see from the above, lease expiries remained well spread as compared to 1H2024.
CICT Share Price and Current Dividend Yield

CICT share price closed at S$1.98 on Friday, 7th February 2025. As you can see from the above chart, CapitaLand Integrated Commercial Trust share price was on a 6-months downtrend since September. Based on CapitaLand Integrated Commercial Trust share price of S$1.98 on FY24 full year DPU of 10.88 cents, this translates to a current dividend yield of 5.49%.

Summary of CICT FY2024 Financial Results
We have come to the last section and again I will summarize the pros and cons based on CICT FY2024 full year financial results. The pros are:
- In FY2024, CICT’s Gross Revenue and Net property income (NPI) grew 1.7% and 3.4% respectively.
- Full year Distribution Per Unit (DPU) grew 1.2% to 10.88 cents.
- Overall portfolio achieved a high committed occupancy of 96.7%.
- The Singapore retail and office portfolios achieved rent reversions of 8.8% and 11.1% respectively.
- CapitaLand Integrated Commercial Trust dividend was 10.88 cents. At S$1.98 per unit, the current dividend yield is acceptable to me at 5.49%.
- Aggregate leverage stood healthy at 38.5%.
The cons are:
- Multiple Asset Enhancements Initiatives to refresh its malls which means temporary loss of income. (AEIs at IMM Building in Singapore and Gallileo in Germany are on track for completion in 2H 2025)
Overall, CICT financial performance is positive. With the positive financial results, will CICT share price reverse its downtrend and go uptrend?