Table of Contents
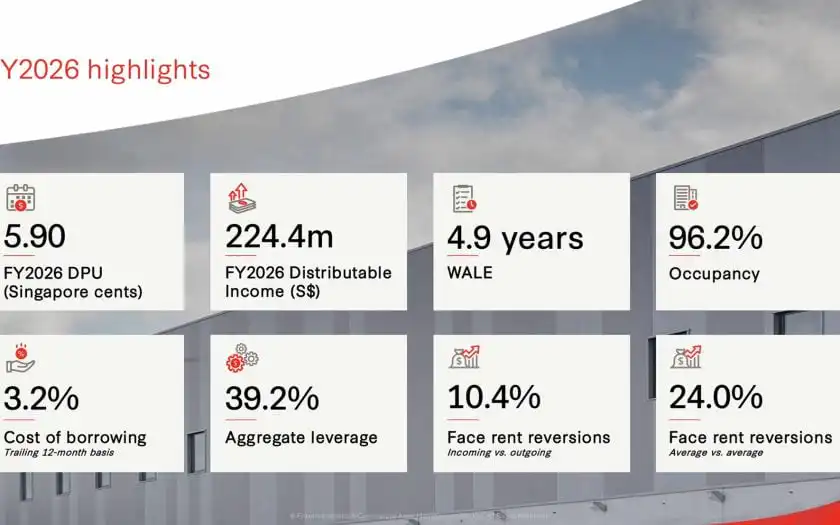
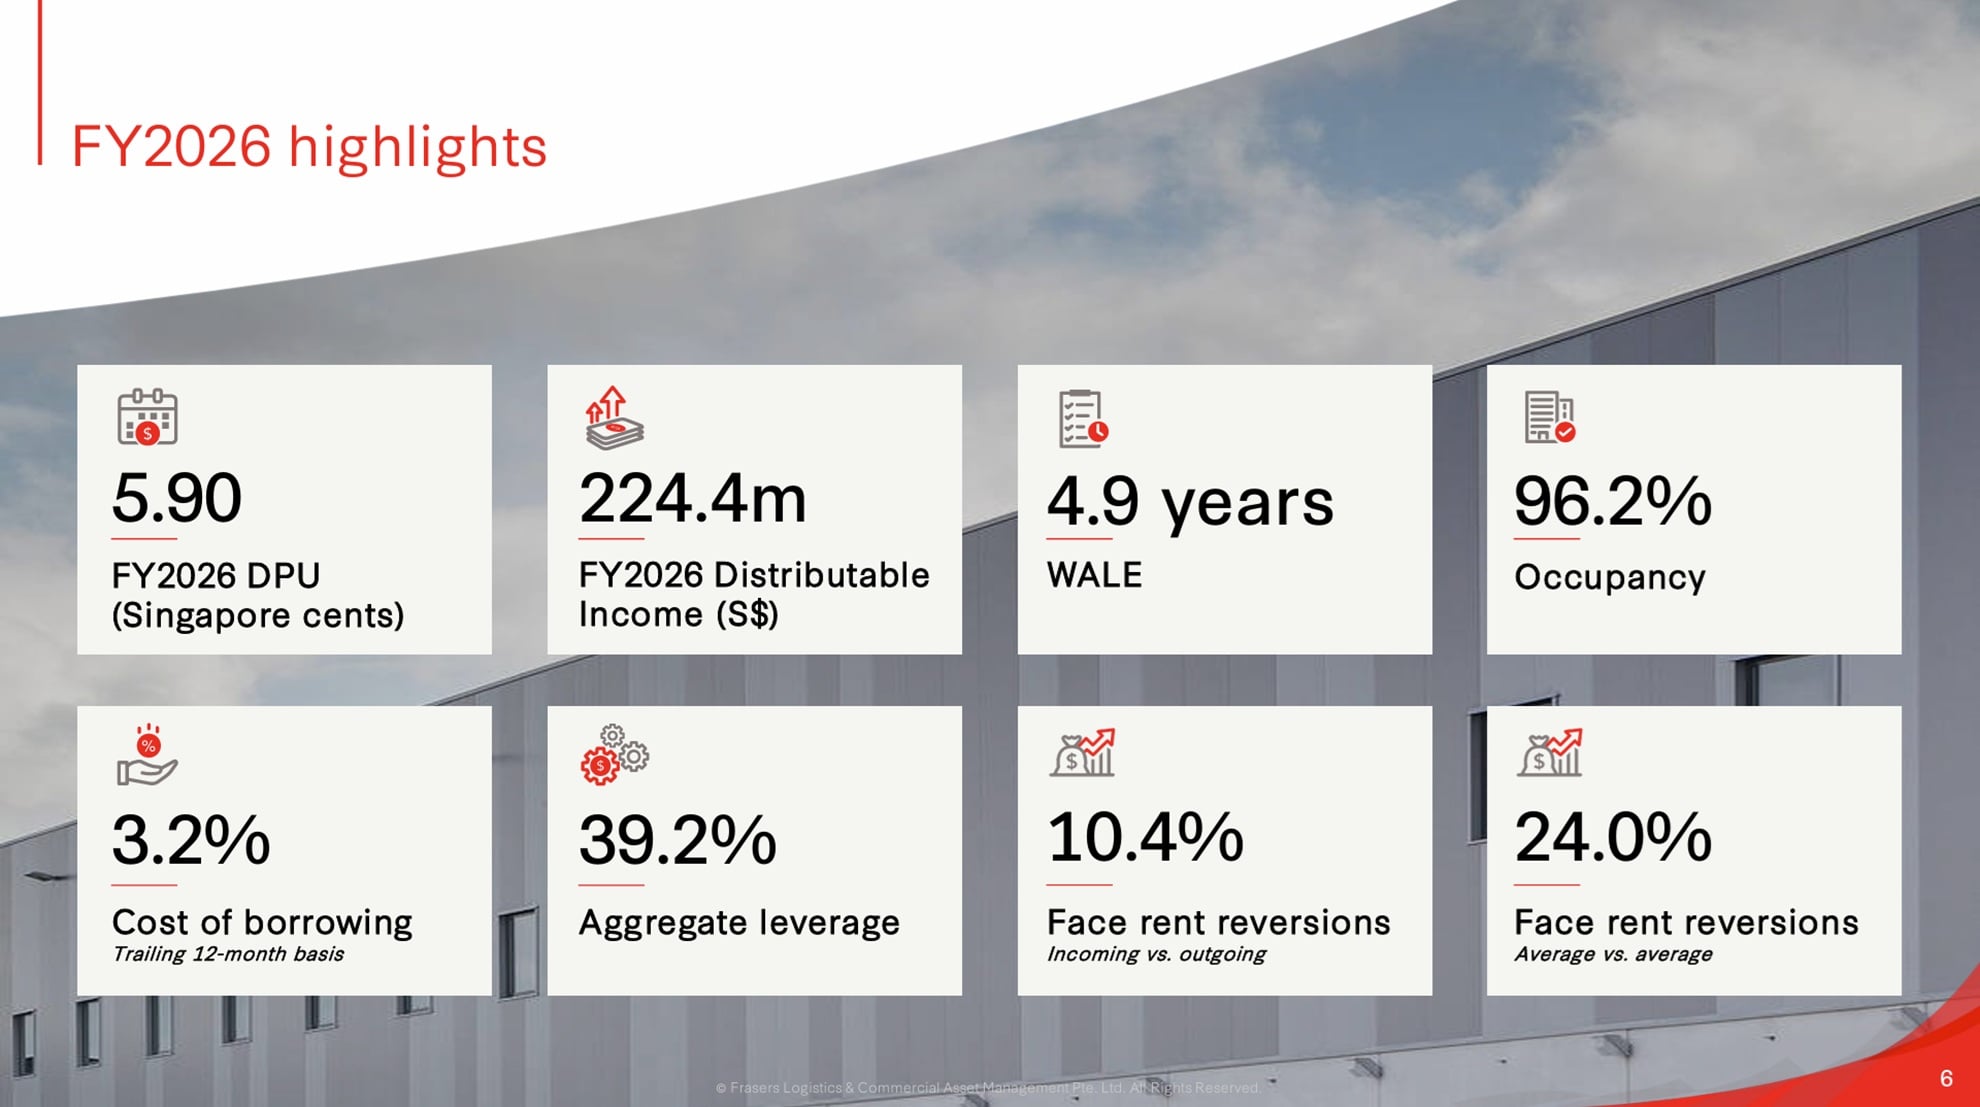
The FLCT FY26 results are out, and Frasers Logistics and Commercial Trust has declared a full year distribution per unit (DPU) of 5.90 Singapore cents for the financial year ended 30 September 2026. On the surface, that is a touch lower than the 5.95 Singapore cents paid in FY2025. Once I looked beneath the headline, however, the picture turned out to be much more encouraging than the small decline suggests, because the REIT is now relying far less on one-off divestment gains to support its payout.
In this post, I will walk through the key numbers, explain what drove the improvement in the underlying distribution, look at the portfolio and balance sheet, and share what I think income investors should keep an eye on heading into FY2027. If you would like to compare these numbers against the previous year, you can read my review of the Frasers Logistics and Commercial Trust FY25 full year results and the more recent 3QFY26 business update.
FLCT FY26 Results at a Glance
Here is a quick summary of the main financial figures in the FLCT FY26 results for the full year and for the second half of the financial year, which ran from 1 April 2026 to 30 September 2026.
| Item | FY2026 | FY2025 | Change |
|---|---|---|---|
| Revenue | S$494.1 million | S$471.5 million | +4.8% |
| Adjusted net property income | S$347.6 million | S$326.1 million | +6.6% |
| Finance costs | S$86.8 million | S$83.0 million | +4.6% |
| Distributable income before divestment gains | S$216.4 million | S$196.8 million | +10.0% |
| Total distributable income | S$224.4 million | S$224.7 million | -0.1% |
| DPU before divestment gains | 5.70 cents | 5.21 cents | +9.4% |
| Capital distribution of divestment gains | 0.20 cents | 0.74 cents | -73.0% |
| Total DPU | 5.90 cents | 5.95 cents | -0.8% |
For the second half alone, revenue rose 6.7% to S$255.2 million and adjusted net property income climbed 9.6% to S$180.6 million. The second half DPU came in at 2.95 Singapore cents, exactly the same as the second half of FY2025. The difference is in the mix: 2.88 cents came from operations and only 0.07 cents came from divestment gains, compared with 2.69 cents and 0.26 cents respectively a year earlier.
Why the Underlying DPU Matters More Than the Headline
Before getting into the details of the FLCT FY26 results, it helps to understand one point. For several years, FLCT has topped up its distributions with what it calls a capital distribution of divestment gains. In simple terms, when the REIT sells a property at a profit, it can pass part of that gain to unitholders. This is perfectly legitimate, but it is not recurring income. A REIT can only sell a building once.
In FY2025, divestment gains made up roughly 12% of the total DPU. In FY2026, that share fell to only about 3%. At the same time, the DPU generated from the actual rental business jumped 9.4% from 5.21 cents to 5.70 cents. So while the total payout dipped very slightly, the quality of the distribution improved noticeably. I would much rather receive 5.90 cents that is mostly backed by rent than 5.95 cents that leans more heavily on property sales.
The manager has also guided that, barring unforeseen circumstances, divestment gains are targeted to make up no more than 5% of the total DPU for FY2027. This tells me the REIT is deliberately weaning itself off this support, which I see as a healthy sign for long-term income investors.
What Drove the Growth in Income
Several factors behind the FLCT FY26 results pushed revenue and net property income higher during the year. The first was the built-in annual rental increases in the logistics and industrial segment. According to the results presentation, about 86% of the portfolio’s leases come with either fixed annual escalations or increases linked to the consumer price index, which gives FLCT a steady, almost automatic source of organic growth.
The second factor was currency. The Australian dollar and the euro were stronger against the Singapore dollar on average compared with the previous year. Since Australia and Europe account for the bulk of FLCT’s assets, this translated into higher income when converted back into Singapore dollars.
The third factor was acquisitions. During the year, FLCT bought a logistics property in the Netherlands for about €43.0 million and interests in four logistics properties in Germany and the Netherlands for about €294.9 million. In total, the REIT completed roughly S$505.6 million worth of acquisitions. It also enjoyed a full year of contribution from 2 Tuas South Link 1 in Singapore, and occupancy improved at Alexandra Technopark.
On the other side of the ledger, income was held back by the sale of 357 Collins Street in Melbourne in September 2025, as that building no longer contributed rent. Higher non-recoverable land taxes in Victoria and Queensland in Australia also weighed on the numbers.
Higher Finance Costs and the Role of Management Fees
Finance costs rose 4.6% for the full year and 8.2% in the second half. This was mainly because FLCT refinanced existing loans at higher interest rates and took on additional borrowings to fund its acquisitions. Repaying debt with the proceeds from the 357 Collins Street sale helped soften the increase.
One detail that retail investors often overlook is how management fees are paid. For FY2026, 75.0% of management fees were paid in new units rather than in cash, up from 69.8% in FY2025. Paying fees in units preserves cash for distributions, which helps the DPU in the short term. The trade-off is that new units are issued, which gradually dilutes existing unitholders. It is worth noting that in the second half, the proportion paid in units actually fell from 96.0% to 75.0%, so the improvement in second half operating DPU was achieved despite a smaller boost from this source. The manager expects at least 75% of fees to be taken in units again in FY2027.
Portfolio Occupancy and Rental Reversions
FLCT now owns 118 properties across Australia, Germany, Singapore, the United Kingdom and the Netherlands. Overall portfolio occupancy stood at 96.2% as at 30 September 2026, with a weighted average lease expiry of 4.9 years.
The logistics and industrial portfolio continues to be the star performer, with occupancy of 99.1%. Its Australian and European logistics assets are almost fully let. The commercial portfolio is weaker at 89.7%, and this is where most of the challenges lie.
Rental reversions, which compare the rent on new or renewed leases against the previous rent, were strong. Across the whole portfolio, reversions were 10.4% when comparing the starting rent of the new lease with the final rent of the old lease, and 24.0% when comparing the average rent across both leases. For logistics and industrial properties alone, the figures were even better at 12.3% and 28.3%. Some individual Australian deals in the fourth quarter saw reversions above 40%.
Even more encouraging, the independent valuers estimate that the rents FLCT is currently collecting are on average about 9% below market levels. This suggests there is still room for positive reversions as leases come up for renewal over the next few years.
The tenant base is also well spread out. The top ten tenants make up about 24.5% of gross rental income, and none of them individually accounts for more than 5%. Names include the Commonwealth Bank of Australia, Hermes Germany, CEVA Logistics, DSV, Rio Tinto and BMW.
The Commercial Portfolio Remains the Weak Spot
Alexandra Technopark in Singapore, which is FLCT’s largest single commercial asset, had occupancy of 85.7%. The REIT has been working to fill space vacated by a major technology tenant, and the presentation notes that a lease signed after the quarter ended has lifted the backfilling of that space to around 90%. That is good progress, but it has taken time.
The United Kingdom business parks are the bigger concern. Farnborough Business Park sat at about 85% occupancy and Maxis Business Park at about 83%. Valuations for the three United Kingdom commercial properties fell by nearly 20% compared with their carrying value. FLCT has been gradually selling off buildings at Blythe Valley Business Park, including the Juniper building during the year and the Aspen and Elder buildings in October 2026, the latter at a premium of almost 18% to valuation. I think continued recycling of these weaker office assets into logistics properties is the right direction.
As a result of these efforts, logistics and industrial assets now make up 78.1% of the portfolio, up from 75.1% a year ago.
Property Valuations and Net Asset Value
The full portfolio was valued at about S$7.2 billion, which is 2.3% below its carrying value. The logistics and industrial properties held up well with only a 0.4% decline, while the commercial properties fell 8.7%. The manager pointed to vacancies, softer property yields and weaker euro and pound sterling as the main reasons, partly offset by strong leasing in logistics and a firmer Australian dollar.
Because of these fair value losses, net asset value per unit slipped from S$1.10 to S$1.07. With the unit price at S$0.88 as at 30 September 2026, FLCT was trading at roughly an 18% discount to its net asset value. For value-oriented income investors, that discount is worth noting, although it also reflects market concerns about interest rates and the commercial assets.
Balance Sheet and Capital Management
This is the section of the FLCT FY26 results I spent the most time on. Aggregate leverage rose to 39.2% as at 30 September 2026, mainly because of the borrowings taken on for acquisitions. While this is still comfortably below the regulatory limit of 50%, it leaves only about S$100 million of debt headroom before leverage reaches 40%. In practical terms, this means FLCT will likely need to keep selling assets or raise equity if it wants to make further large acquisitions.
On the positive side, the interest coverage ratio remains healthy at 4.5 times, and about 70.9% of borrowings are on fixed rates. The average cost of borrowing for the year was 3.2%, only slightly up from 3.1% a year earlier. The weighted average debt maturity is 3.1 years, and FLCT has S$234 million of undrawn committed facilities available to meet its debt obligations due in FY2027. Fitch rates the REIT at BBB+ with a stable outlook.
The manager has warned that its cost of borrowing is expected to rise in FY2027 because of higher interest rates on variable rate loans and upcoming refinancing. The presentation includes a helpful sensitivity figure: every 0.5 percentage point increase in interest rates on its variable rate borrowings would reduce DPU by about 0.11 Singapore cents a year. That is about 2% of the FY2026 operating DPU, which is manageable but not trivial.
FLCT Distribution Yield and Key Dates
Based on the annualised second half DPU and the closing price of S$0.88 on 30 September 2026, FLCT offered a distribution yield of about 6.7%. For a REIT with a large, high-quality logistics portfolio and a strong sponsor in Frasers Property, I think that is an attractive level of income.
For investors who want to receive the second half distribution of 2.95 Singapore cents, the ex-distribution date is 18 November 2026, the record date is 19 November 2026, and payment will be made on 23 December 2026. FLCT pays distributions twice a year.
Outlook for FY2027
The manager remains cautious about the wider environment. Conflicts in the Middle East and Ukraine have kept energy prices high, trade barriers have increased, and geopolitical tension is weighing on business and consumer confidence. Global container freight rates have risen sharply this year, although trade volumes have so far held up. FLCT says it has not seen any material direct impact on its operations, occupancy or leasing from these developments.
Over the longer term, the manager believes the case for prime logistics assets remains strong, supported by e-commerce growth, companies building more resilient supply chains, and the trend of moving production closer to end markets. The plan is to keep increasing the share of logistics and industrial assets in the portfolio while working on the commercial vacancies.
My Thoughts on FLCT FY26 Results
Overall, I think the FLCT FY26 results were solid. The headline DPU was almost flat, but the far more important number is the 9.4% growth in DPU from operations. That growth came from real drivers such as rental escalations, positive reversions and accretive acquisitions, rather than from selling buildings.
The main risks I see are the rising cost of debt in FY2027, leverage that is now close to 40%, and the continued drag from the United Kingdom business parks. Currency movements can also swing the numbers in either direction, as this year showed with a stronger Australian dollar but weaker euro and pound sterling. I would also keep an eye on the management fees paid in units, since a lower proportion in future would trim the cash available for distributions.
Frasers Logistics and Commercial Trust is one of the REITs I hold, and you can see how it fits alongside my other income-generating holdings in my stock portfolio. For the official documents, the full results presentation and press release are available on the Frasers Logistics and Commercial Trust investor relations page.
FLCT FY26 Results
The FLCT FY26 results show a REIT that is growing its underlying income steadily while reducing its dependence on one-off gains. Strong leasing in logistics, rents that remain below market, and a high level of contracted rental increases give me confidence in the stability of the distribution. At the same time, higher borrowing costs, limited debt headroom and weak United Kingdom office assets mean the path ahead will not be entirely smooth. For income investors who are comfortable with some currency and interest rate risk, Frasers Logistics and Commercial Trust remains a REIT worth following closely, and I will be watching the FY2027 updates to see whether the underlying DPU growth can be sustained.
Disclaimer: This article is for informational and educational purposes only and does not constitute financial advice. Please do your own research or consult a licensed financial adviser before making any investment decisions.