On 7th May 2025, Frasers Logistics and Commercial Trust announced their 1HFY25 Financial Results. This Logistic and Commercial REIT (Real Estate Investment Trust) had a portfolio comprising of 114 industrial and commercial properties, worth approximately S$6.8 billion, diversified across five major developed markets – Australia, Germany, Singapore, the United Kingdom and the Netherlands. Currently, Frasers Logistics and Commercial Trust makes up 7.44% of my stock portfolio.
For continuous three financial year (FY22, FY23 and FY24), the distribution per unit has been lower. Can the REIT turn around in 2HFY25? What is Frasers Logistics and Commercial Trust’s share price and current dividend yield? These answers can usually be found in the latest financial results.
Let us take a look at its 1HFY25 financial results below to find out more.
Frasers Logistics and Commercial Trust 1HFY25 Financial Results
In 1HFY25, Gross Revenue increased by 7.5% year-on-year to S$232.0 million. Adjusted Net Property Income increased by 1.6% year-on-year to S$161.3 million. The higher revenue and Net Property Income was attributed to the full contributions from Ellesmere Port, acquisition of interests in four German logistics properties, Maastricht Property in the Netherlands and from the acquisition of 2 Tuas South Link 1.
The gains were partially offset by higher vacancies in ATP and 357 Collins Street, effects of lower average exchange rates (of AUD and EUR against the SGD) and higher non-recoverable land taxes for Victoria and Queensland, Australia from January 2024 and July 2024 respectively.
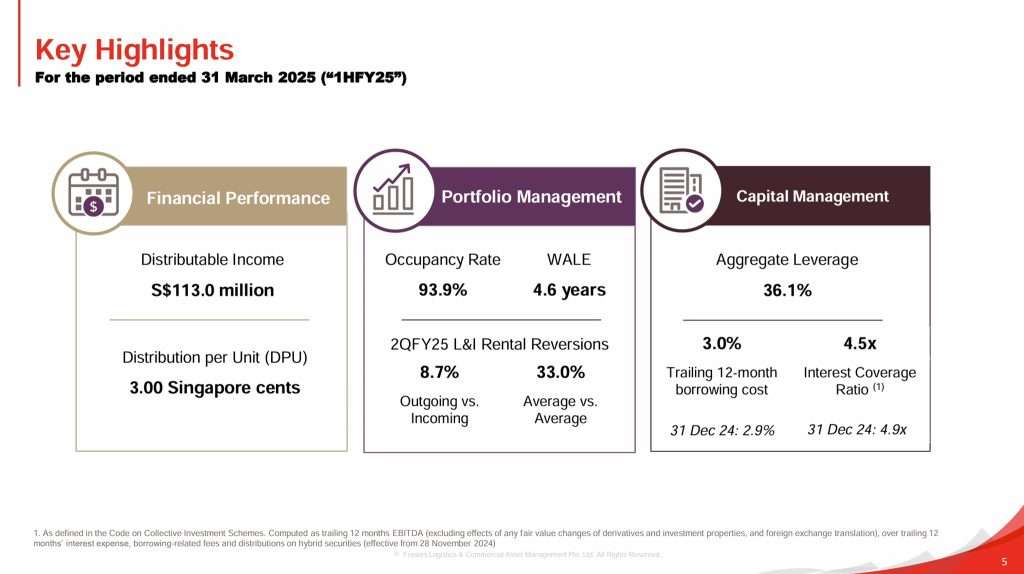
Despite the increase, distributable income decreased by 18.9%. This was due to higher finance costs, higher tax expense and 56.9% of 1HFY25 management fees paid in the form of cash.
As a result of the above, Distribution Per Unit (DPU) declined by 13.8% year-on-year to 3.00 cents.
| 1HFY25 (S$’000) |
1HFY24 (S$’000) |
Change | |
| Gross Revenue | 232,326 | 216,026 | 7.5% |
| Adjusted Net Property Income | 161,256 | 158,694 | 1.6% |
| Finance Cost |
39,447 | 29,221 | 35.0% |
| Amount Distributable to Unitholders | 95,014 | 117,192 | (18.9%) |
| Distribution Per Unit (“DPU”) (cents) | 3.00 | 3.48 | (13.8%) |
Debt
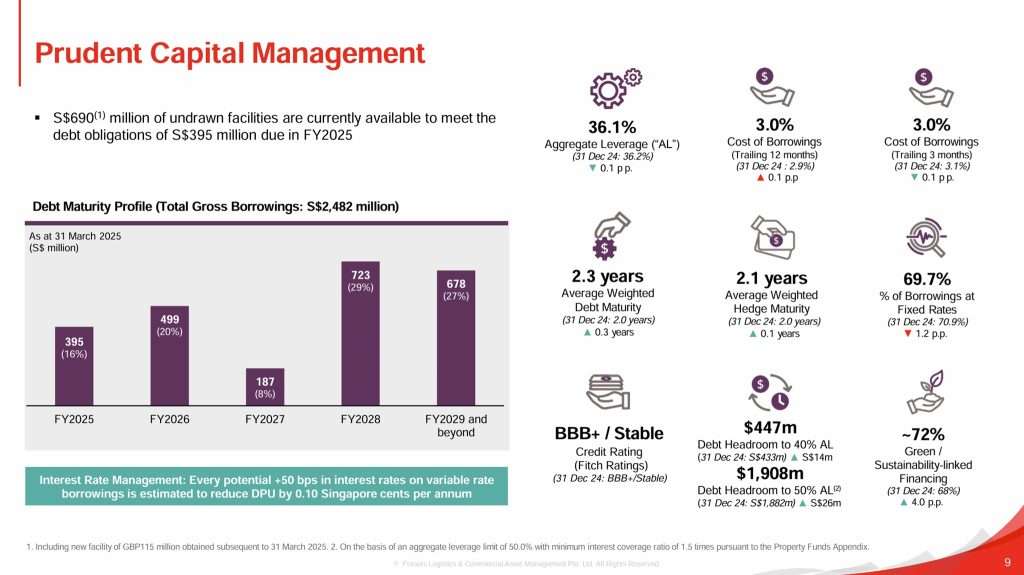
Aggregate leverage, also known as gearing ratio, refers to the ratio of a real estate investment trust’s (REIT) debt to its total assets. As of 31st March 2025, Frasers Logistics and Commercial Trust’s aggregate leverage stood healthy at 36.1%. There is still S$690 million of undrawn facilities that are currently available to meet the debt obligations of S$395 million due in FY2025.
Weighted average debt maturity stood at 2.3 years. 69.7% of its borrowings are hedged at fixed rates to mitigate against the risk of sudden interest rate hikes.
As you can see from the above, Fitch has given Frasers Logistics and Commercial Trust a “BBB+” rating with a stable outlook. ‘BBB’ ratings indicate that expectations of default risk are currently low. The capacity for payment of financial commitments is considered adequate, but adverse business or economic conditions are more likely to impair this capacity.
Occupancy
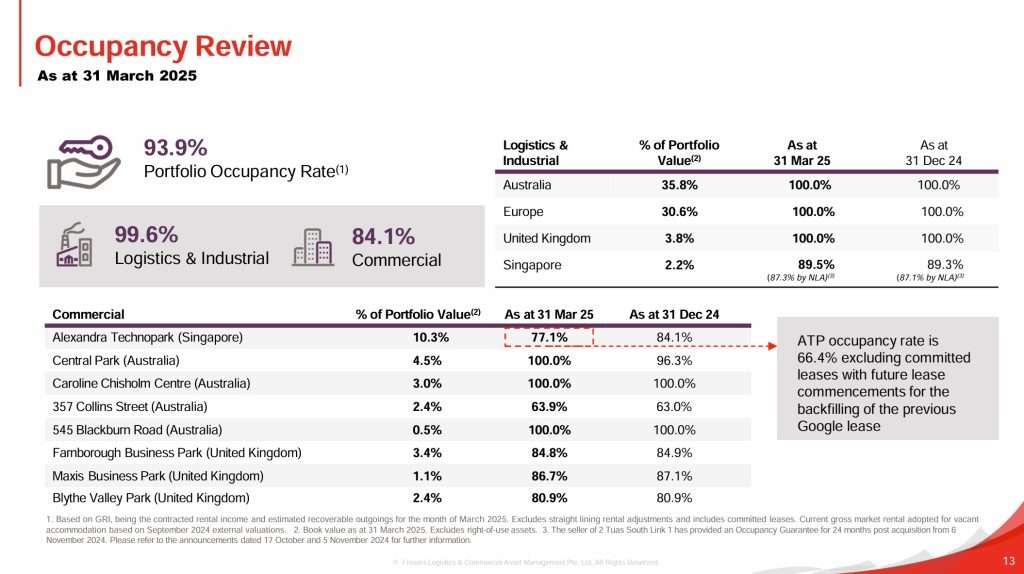
In this section, let us look at Frasers Logistics and Commercial Trust portfolio occupancy. As you can see from the slide above, overall portfolio occupancy stood at 93.9%. The occupancy for the Logistics and Industrial segment remains strong at 99.6% while the occupancy rate for Commercial segment stood lower at 84.1%.
Lease Expiry Profile
Frasers Logistics and Commercial Trust’s lease expiry remained well spread. In 2QFY25, Frasers Logistics and Commercial Trust achieved positive portfolio average rental reversion of +2.5% on an incoming rent vs. outgoing rent basis (“incoming vs outgoing”) and +19.2% for the average rent of the new/renewal lease as compared to the average rent of the preceding lease (“average rent vs. average rent”).
Rental reversion refers to the process of adjusting the rental rate of a property at the end of a lease term. This adjustment is typically based on the current market rates and the terms of the original lease agreement. The goal of rental reversion is to ensure that the property owner is receiving fair market value for their rental property.
During a rental reversion process, the property owner may negotiate with the tenant to agree on a new rental rate that reflects the current market conditions. This negotiation may involve factors such as the condition of the property, the location, and any improvements that have been made since the original lease agreement was signed.
Frasers Logistics and Commercial Trust Share Price and Dividend Yield
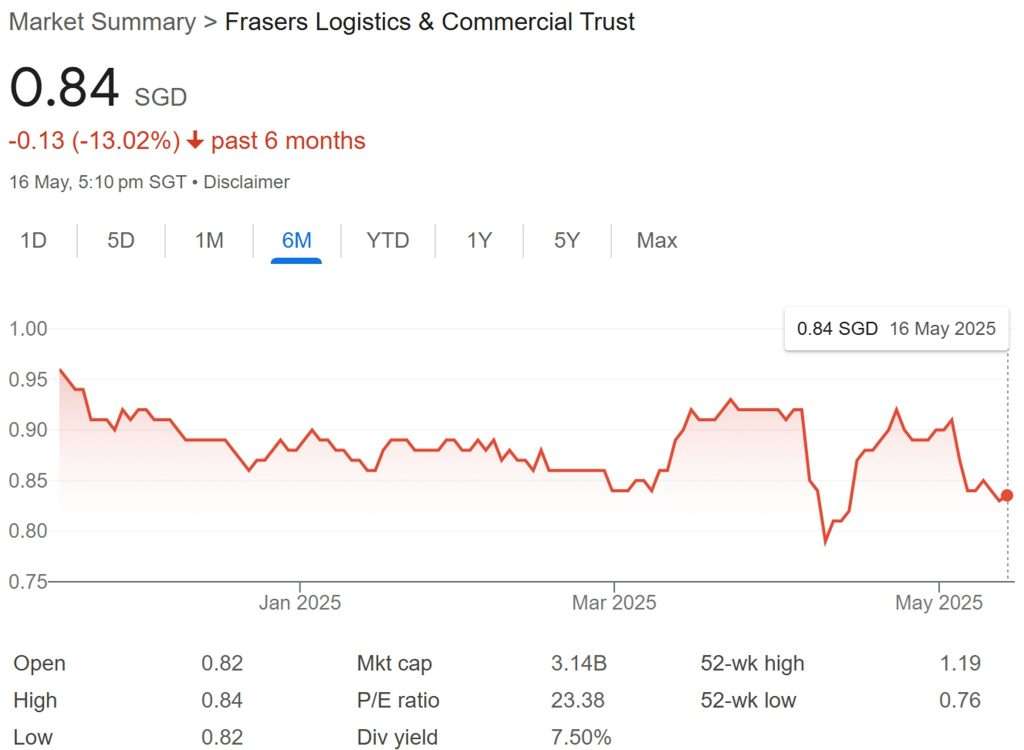
As you can see from the above 6-month share price chart of Frasers Logistics and Commercial Trust, the share price is on a slight downtrend. Frasers Logistics and Commercial Trust share price closed at S$0.84 on 16th May 2025. Based on Frasers Logistics and Commercial Trust’s FY24 full year distribution of 6.08 cents, the current dividend yield is 7.24%.
Summary of Frasers Logistics and Commercial Trust 1HFY25 Financial Results
Is Frasers Logistics and Commercial Trust a good investment? Based on the above, let me summarize the pros and cons for you to decide.
The pros are:
- Gross revenue and Adjusted NPI increased 7.5% and 1.6% respectively.
- Aggregate leverage stood healthy at 36.1%.
- 69.7% of borrowings are hedged at fixed rates to mitigate against the risk of sudden interest rate hikes.
- BBB+ Fitch Rating meaning stable outlook.
- Healthy overall portfolio occupancy at 93.9%.
- Positive portfolio average rental reversion of +2.5% on an incoming rent vs. outgoing rent basis (“incoming vs outgoing”).
- Well spread lease expiry.
- Attractive current dividend yield of 7.24%.
The cons are:
- Finance costs increased by 35%.
- Lower average exchange rates (of AUD and EUR against the SGD).
- Distribution Per Unit fell by 13.8%.
