

On 6th November 2024, Frasers Logistics and Commercial Trust (FLCT) released their FY24 Full Year Results. The distribution per unit (DPU) declared for 2HFY24 was 3.32 cents. Together with 2.76 cents announced in 1HFY24, Frasers Logistics and Commercial Trust’s full year DPU was 6.08 cents.
Frasers Logistics and Commercial Trust makes up 7.95% of my stock portfolio. For continuous two financial year (FY22 and FY23), the distribution per unit has been lower. What happened? Because of the headwinds, the share price also took a nosedive. What is Frasers Logistics and Commercial Trust’s current share price and current dividend yield?
Let us look into the details of Frasers Logistics and Commercial Trust’s financial results to find out more.
Frasers Logistics and Commercial Trust 2HFY24 Financial Results
In 2HFY24, revenue was higher due to contributions from Ellesmere Port, which was completed in December2023 and from the acquisition of interests in four German logistics properties on 27th March 2024. The contributions were partially offset by higher vacancies in Alexandra Technopark and 357 Collins Street, as well as higher property operating expenses.
Finance cost was 45.6% higher, mainly due to the increase in interest rates and additional borrowings drawn for capital expenditure, fund through developments and acquisitions.
As a result, Distributable income for 2HFY24 was correspondingly lower at S$124.9 million, from S$131.6 million in 2HFY23.
Thus, Distribution Per Unit (DPU) was 6.6% lower in 2HFY23 at 3.52 cents, from 3.77 cents in 2HFY22.
| 2HFY24 (S$’000) |
2HFY23 (S$’000) |
Change (%) | |
| Gross Revenue | 230,648 | 212,801 | 8.4 |
| Adjusted Net Property Income | 161,311 | 155,525 | 3.7 |
| Finance Cost |
36,437 | 25,033 | 45.6 |
| Amount Distributable to Unitholders | 124,853 | 131,557 | (5.1) |
| Distribution Per Unit (“DPU”) (cents) | 3.32 | 3.52 | (5.7) |
Frasers Logistics and Commercial Trust FY24 Full Year Financial Results
For the full year, Frasers Logistics and Commercial Trust’s revenue was 6.2% higher as compared to FY23. This was mainly attributed to contributions from Worcester and Connexion II, partial-year contributions from Ellesmere Port, which achieved practical completion in December 2023, and from the acquisition of interests in four German logistics properties on 27 March 2024.
The contributions were partially offset by higher vacancies in Alexandra Technopark and 357 Collins Street, as well as higher property operating expenses.
The full year finance cost was 40.4% higher in FY24 as compared to FY23. Similar to what was shared above, the increase in finance cost was mainly due to the increase in interest rates and additional borrowings drawn for capital expenditure, fund through developments and acquisitions.
Frasers Logistics and Commercial Trust’s FY24 full year distribution was 6.80 cents which was 3.4% as compared to 7.04 cents a year ago.
| FY24 (S$’000) |
FY23 (S$’000) |
Change (%) | |
| Gross Revenue | 446,674 | 420,782 | 6.2 |
| Adjusted Net Property Income | 320,005 | 311,442 | 2.7 |
| Finance Cost |
65,658 | 46,763 | 40.4 |
| Amount Distributable to Unitholders | 255,515 | 262,339 | (2.6) |
| Distribution Per Unit (“DPU”) (cents) | 6.80 | 7.04 | (3.4) |
Debt
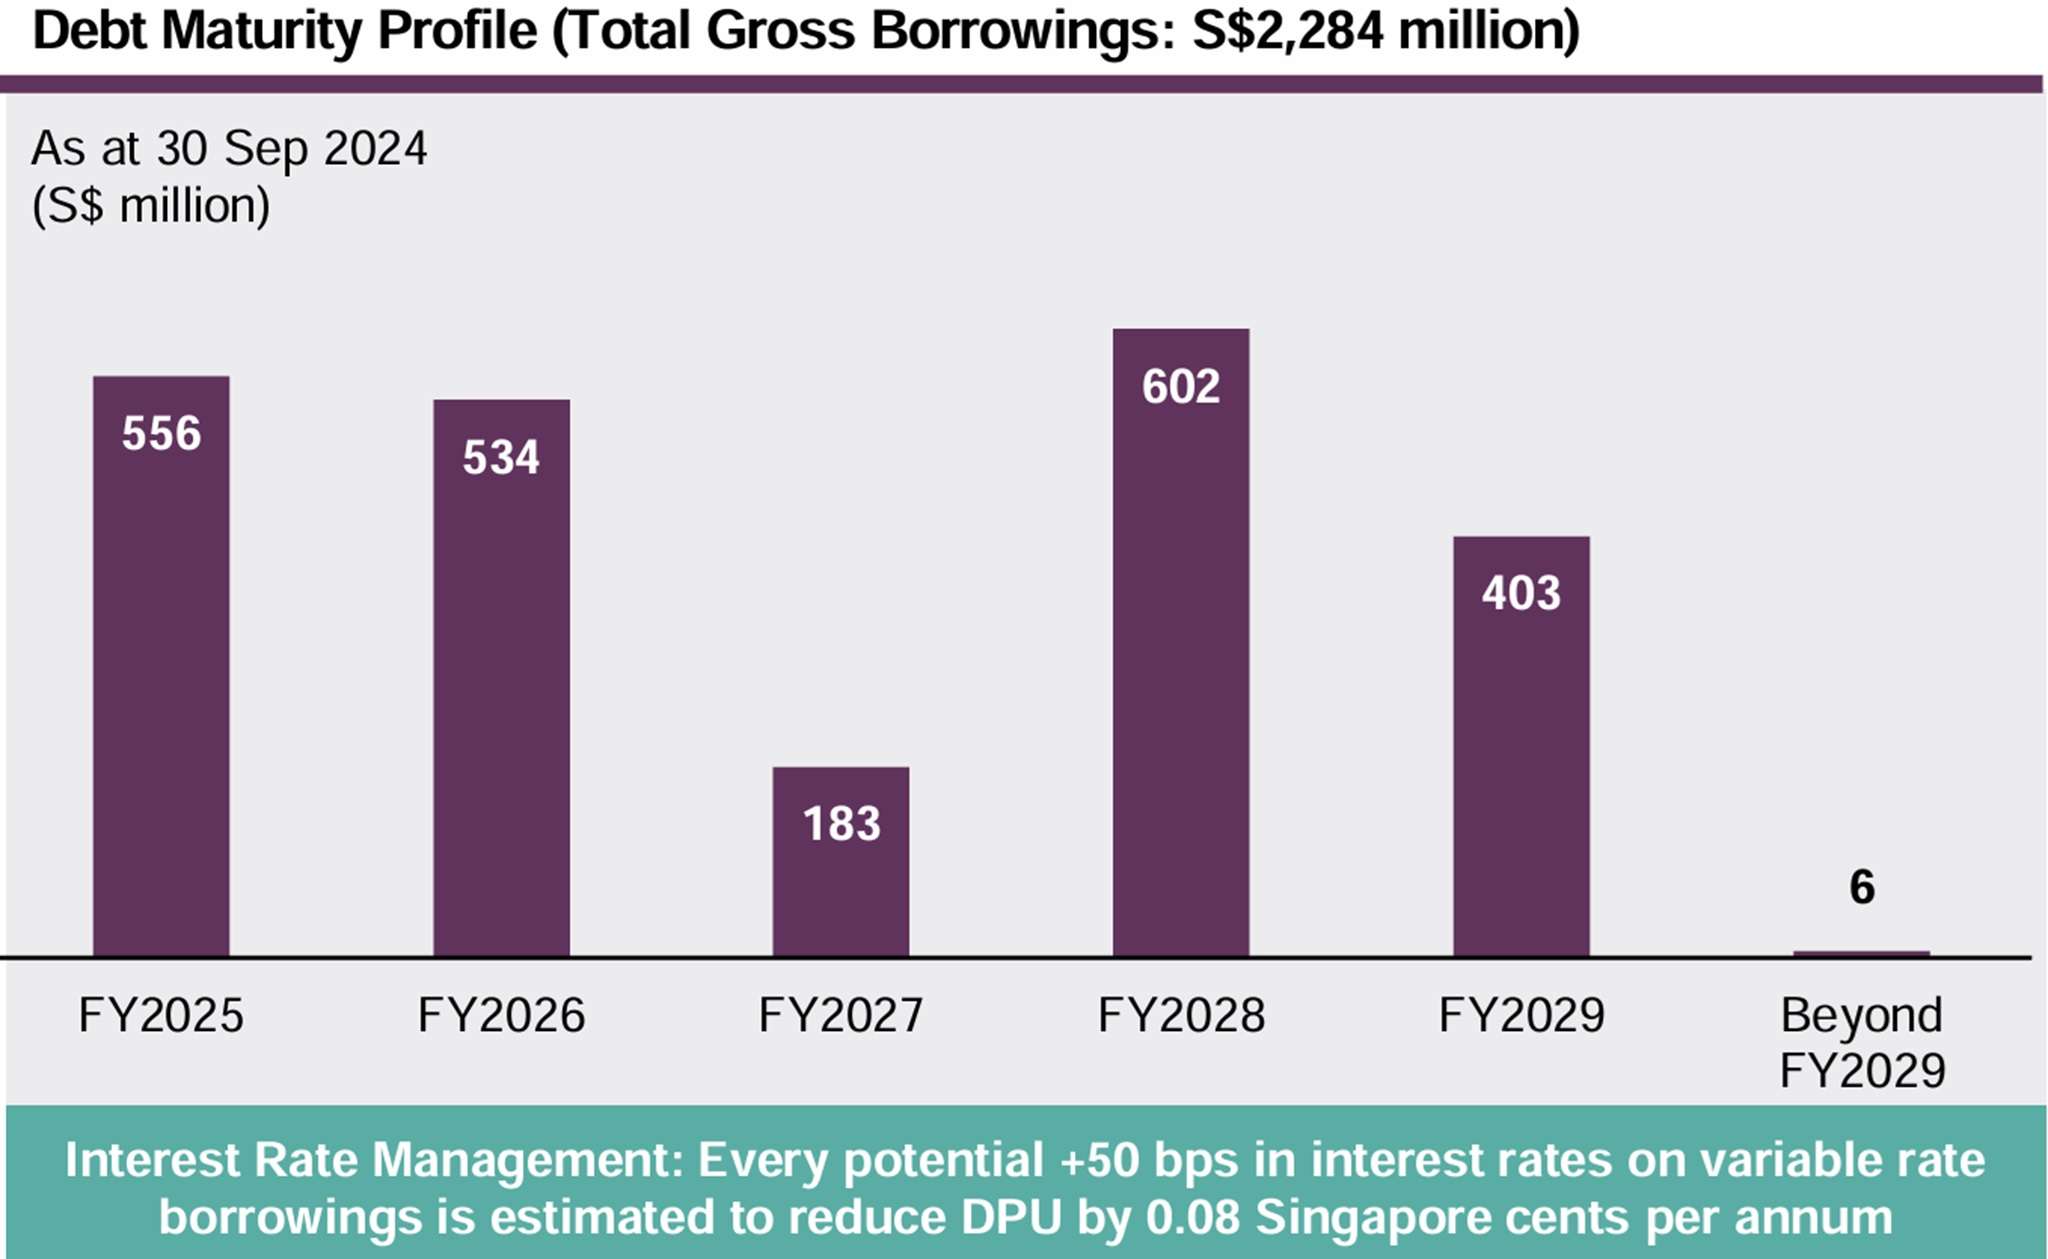
As of 30th September 2024, Frasers Logistics and Commercial Trust’s aggregate leverage stood healthy at 33.0%. There is a debt headroom of S$801 million to reach 40% limit that REITs can borrow.
Average weight debt maturity stood at 2.4 years with 73.3% of borrowings hedged at fixed rates to mitigate against sudden interest rate hikes. Debt maturity profile appears to be well-staggered which is important as a well-staggered debt maturity profile is crucial for REITs to manage their debt obligations effectively. By spreading out debt repayments over different time periods, REITs can avoid liquidity crunches and reduce the risk of default.
Frasers Logistics and Commercial Trust is rated “BBB+” rating by Standard & Poor’s with a stable outlook.
Occupancy
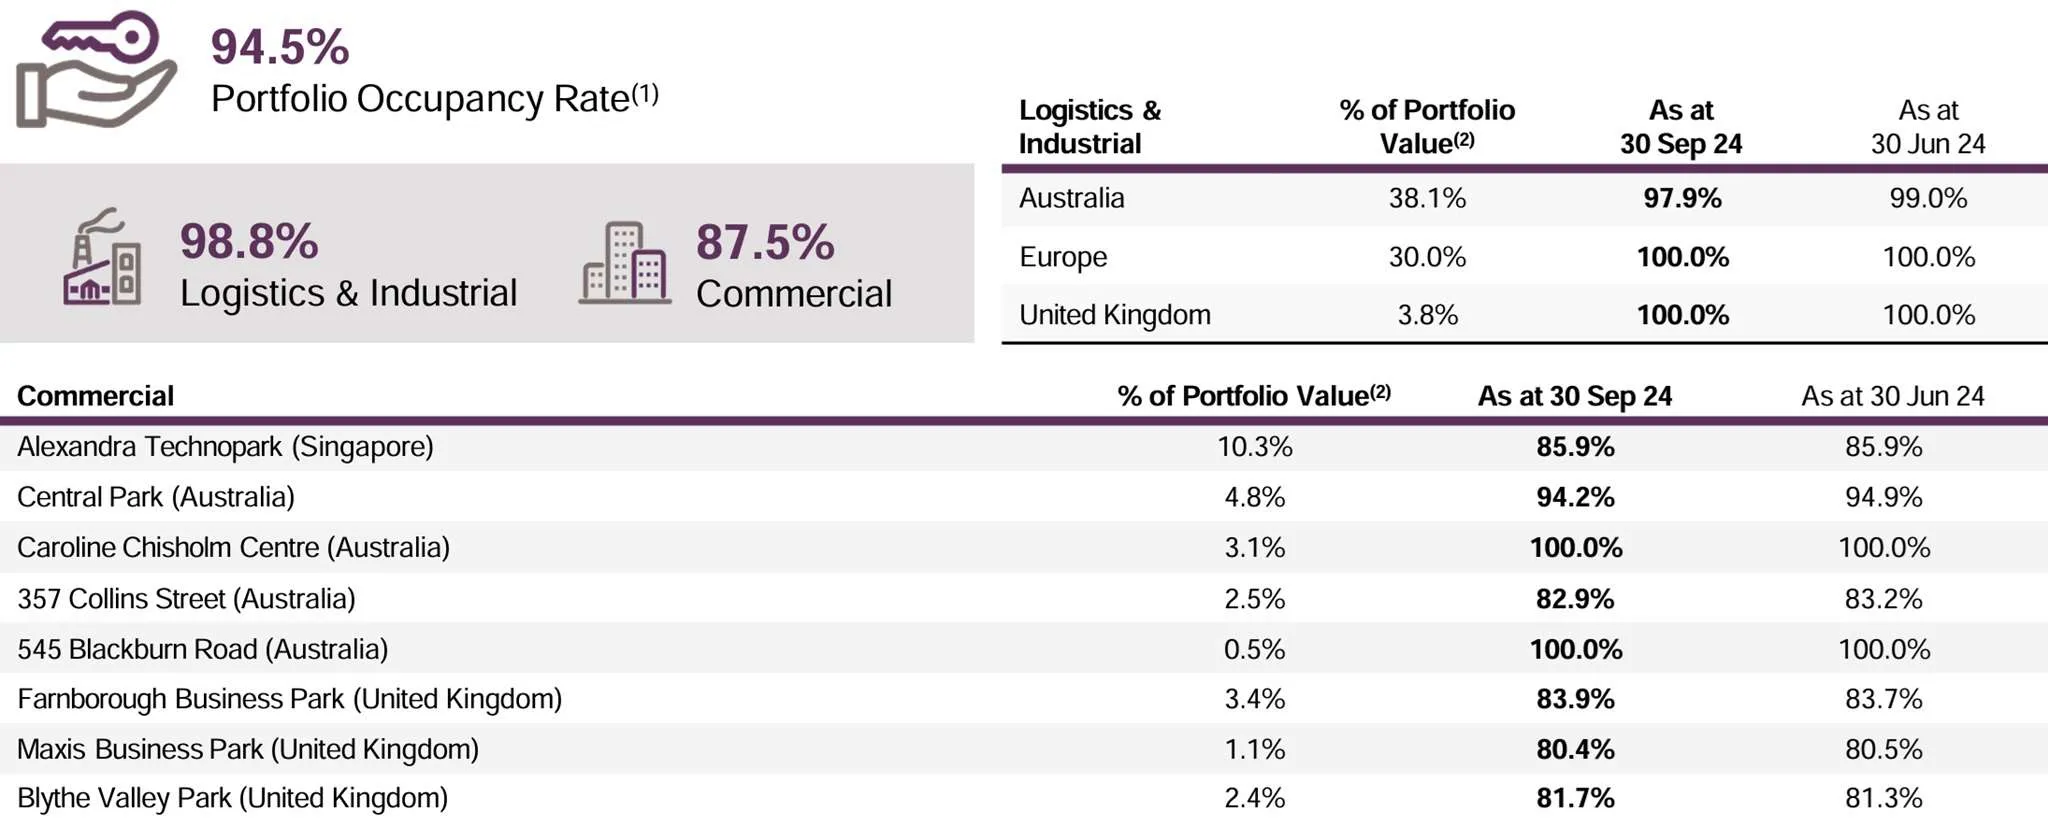
Overall portfolio occupancy stood at 94.5% which was 1.5% lower as compared to FY23. Overall portfolio weighted average lease expiry (“WALE”) is 4.2 years.
Lease Expiry Profile

Lease expiry remains well-spread. The portfolio average rental reversion achieved for FY2024 was +12.8% on an incoming rent vs. outgoing rent basis and +23.6% for the average rent of the new lease as compared to the average rent of the preceding lease (“average rent vs. average rent”).
Do you know what is rental reversion? Rental reversion refers to the change in rental rates when leases are renewed. A positive rental reversion means the new rental rate is higher than the previous rate. A negative rental reversion happens when the new rental rate is lower than the previous rate. Whether the rental reversion is positive or negative depends on the market demand and supply.
What is Frasers Logistics and Commercial Trust’s Current Share Price and Dividend Yield?

What is FLCT share price? FLCT share price closed at S$0.97 on Wednesday, 13th November 2024. Based on FY24 full year distribution of 6.80 cents and FLCT share price of S$0.97, this translates to a current dividend yield of 7.01%.
Summary of Frasers Logistics and Commercial Trust FY24 Full Year Results
Let me summarize the pros and cons based on Frasers Logistics and Commercial Trust FY24 full year financial results.
Pros
- FY24 revenue was 6.2% higher as compared to FY23.
- Aggregate leverage stood healthy at 33.0%.
- Healthy occupancy at 94.5%.
- Lease expiry remains well-spread.
- Positive rental reversion (+12.8% on an incoming rent vs. outgoing rent basis).
- High current dividend yield at 7.01% (Based on S$0.97 per unit)
Cons
- FY24 full year DPU was 3.4% lower at 6.80 cents.
- Full year finance cost was 40.4% higher.
- FY24 occupancy was 94.5% which was 1.5% lower as compared to FY23.