On 7th May 2024, Frasers Logistics and Commercial Trust released their 1HFY24 Financial Results. Currently, Frasers Logistics and Commercial Trust makes up 8.51% of my stock portfolio in terms of value.
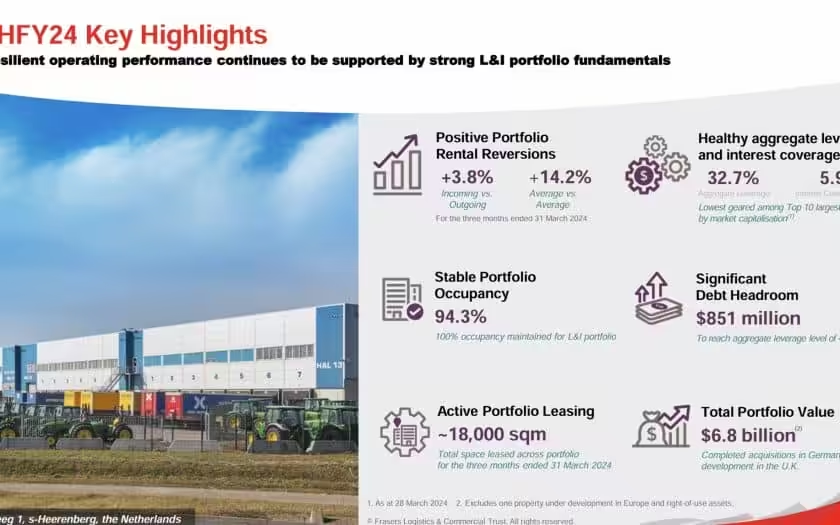
As of 31st March 2024, Frasers Logistics and Commercial Trust’s portfolio comprised of 112 industrial and commercial properties, worth approximately S$6.8 billion, diversified across five major developed
markets – Australia, Germany, Singapore, the United Kingdom and the Netherlands.
How has this giant industrial and commercial REIT (“Real Estate Investment Trust”) performed? What is Frasers Logistics and Commercial Trust share price? What is Frasers Logistics and Commercial Trust dividend yield?
Let us take a look at its 1HFY24 financial results below to find out more.
Frasers Logistics and Commercial Trust 1HFY24 Financial Results
In 1HFY24, Gross Revenue increased by 3.9% year-on-year to S$216.0 million. Adjusted Net Property Income increased by 1.8% year-on-year to S$158.7 million. The increases in revenue and adjusted net property income were due to positive rent reversions and rental escalations, and contributions from Ellesmere Port, Connexion II and Worcester.
Despite the increase, distributable income decreased by 0.1%. This was due to the increase in both operating expenses and finance costs. The increase in property operating expenses were mainly due to higher non-recoverable land taxes in Australia, utilities, repair and maintenance expenses. The finance costs were mainly due to the increase in interest rates and additional borrowings drawn for capital expenditure, fund through developments and acquisitions.
As a result of the above, Distribution Per Unit (DPU) declined by 1.1% year-on-year to 3.48 cents.
| 1HFY24 (S$’000) |
1HFY23 (S$’000) |
Change | |
| Gross Revenue | 216,026 | 207,981 | 3.9% |
| Adjusted Net Property Income | 158,694 | 155,917 | 1.8% |
| Finance Cost |
29,221 | 21,730 | 34.5% |
| Amount Distributable To Unitholders | 130,662 | 130,782 | (0.1%) |
| Distribution Per Unit (“DPU”) (cents) | 3.48 | 3.52 | (1.1%) |
Debt
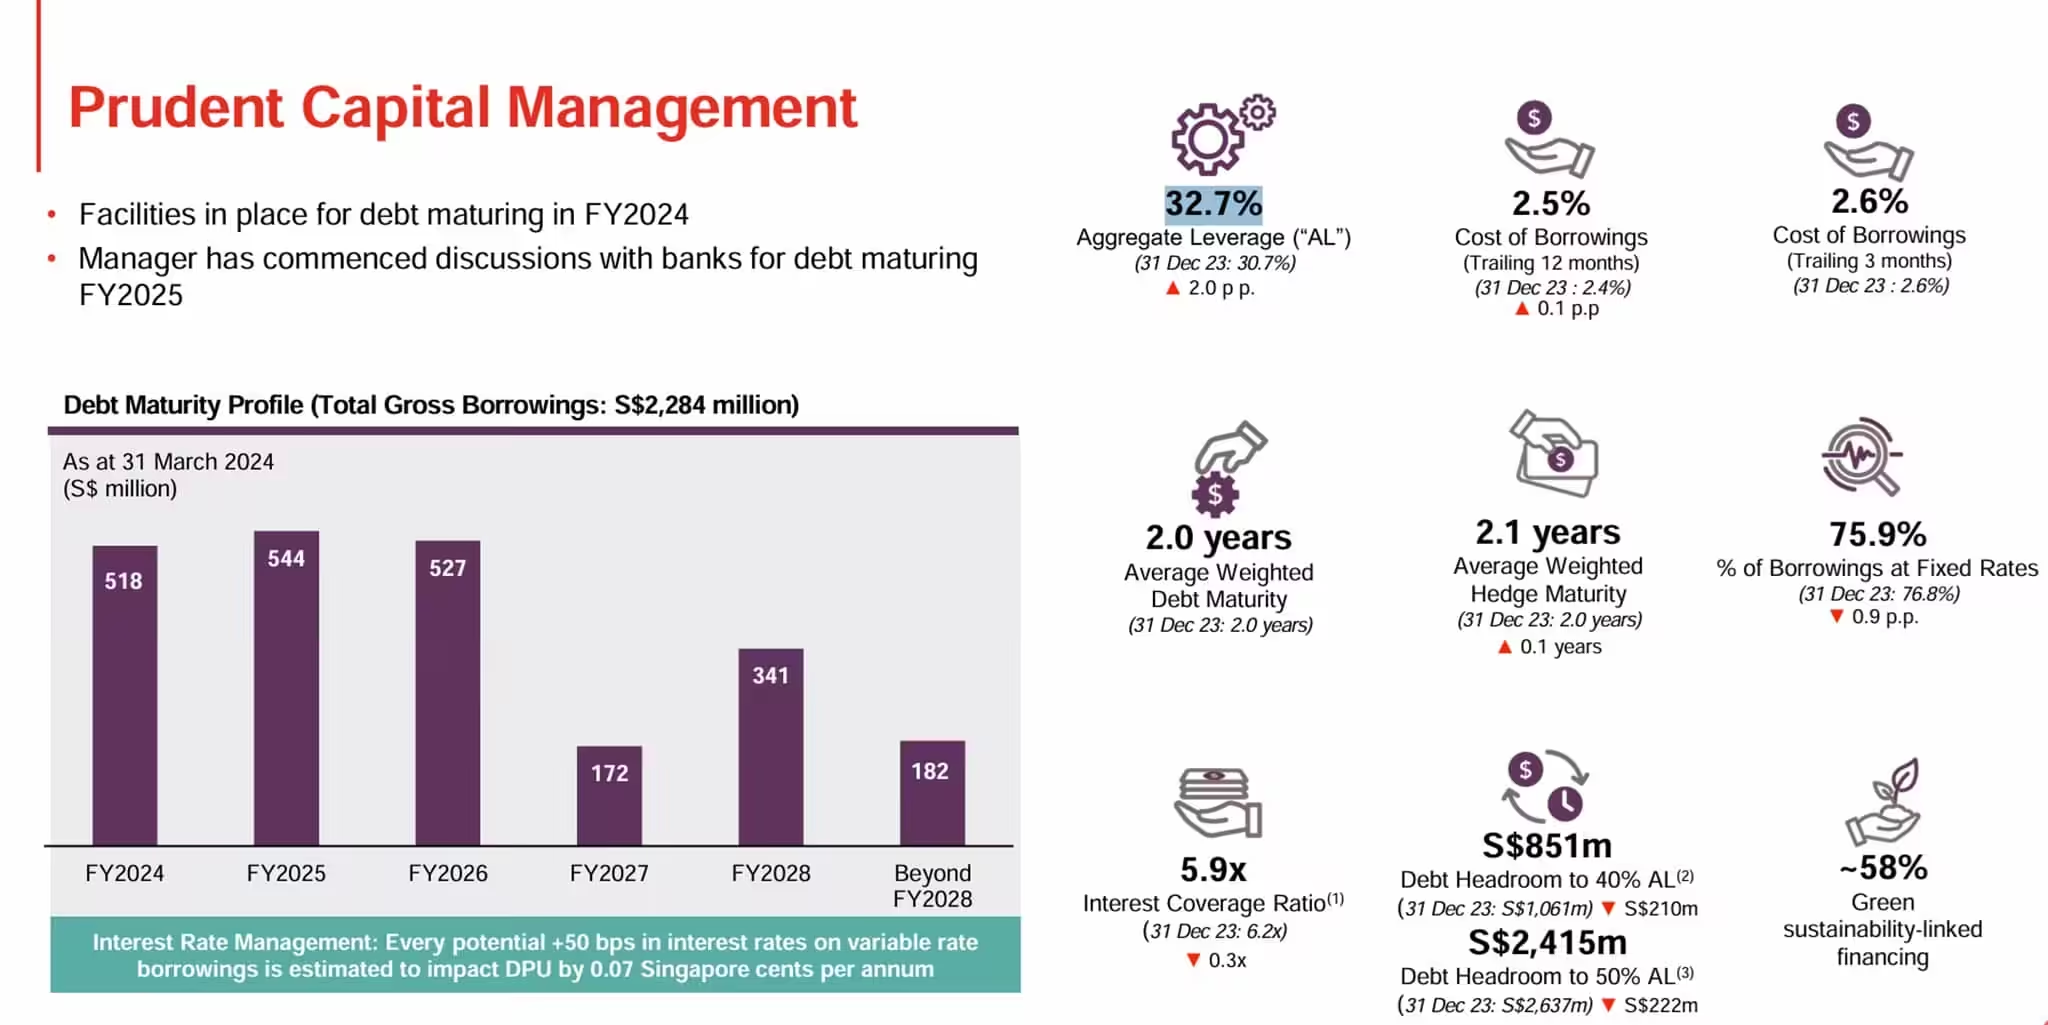
As of 31st March 2024, Frasers Logistics and Commercial Trust’s aggregate leverage stood healthy at 32.7%. There is still a debt headroom of S$851 million available for acquisitions. Its weighted average debt maturity stood at 2.0 years and high interest coverage ratio is 5.9 times.
75.9% of its borrowings are hedged at fixed rates to mitigate against the risk of sudden interest rate hikes.
Occupancy

In this section, let us look at Frasers Logistics and Commercial Trust portfolio occupancy. As you can see from the slide above, overall portfolio occupancy stood at 94.3%. The occupancy for the Logistics and Industrial segment remains strong at 100% while the occupancy rate for Commercial segment fell to 85.0%.
The decline in commercial portfolio occupancy largely due to tenants departing at Alexandra Technopark (Singapore) and tenant downsizing at Central Park (Australia).
Lease Expiry Profile
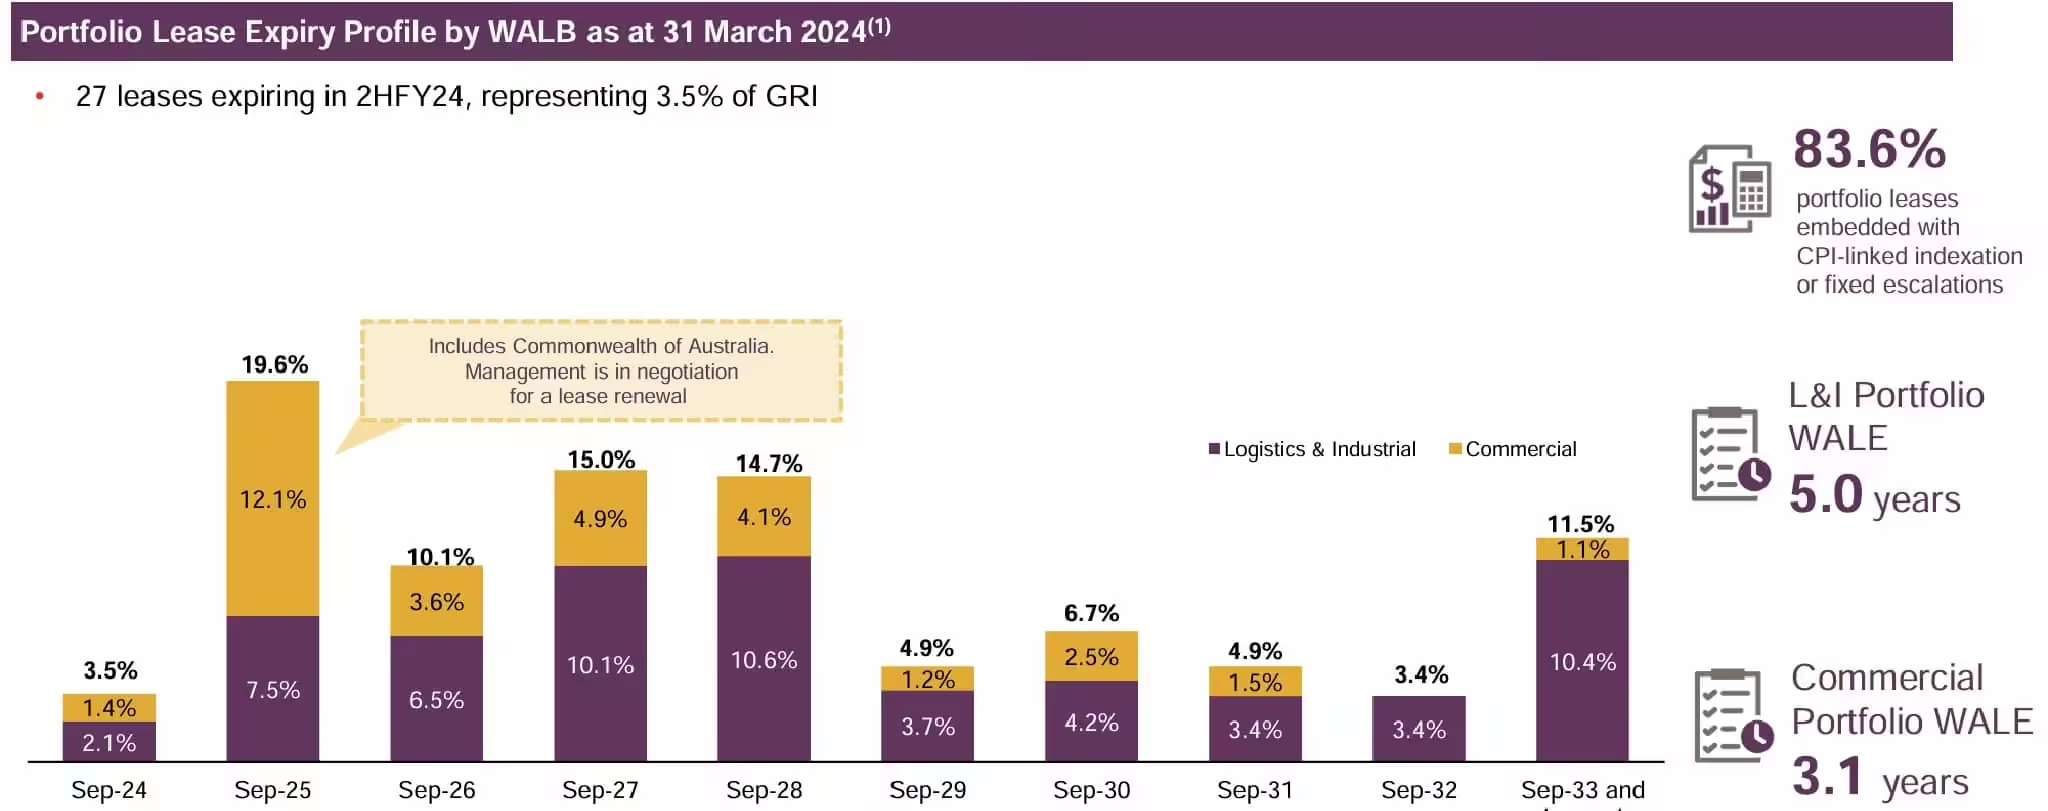
As you can see above, Lease expiry remained well spread. On the back of an active leasing momentum and healthy demand, the portfolio average rental reversion achieved for the period (January to March 2024) was +3.8% on an incoming rent versus outgoing rent basis (“incoming vs outgoing”) and +14.2% for the average rent of the new/renewal lease as compared to the average rent of the preceding lease (“average rent vs average rent”).
Current Dividend Yield
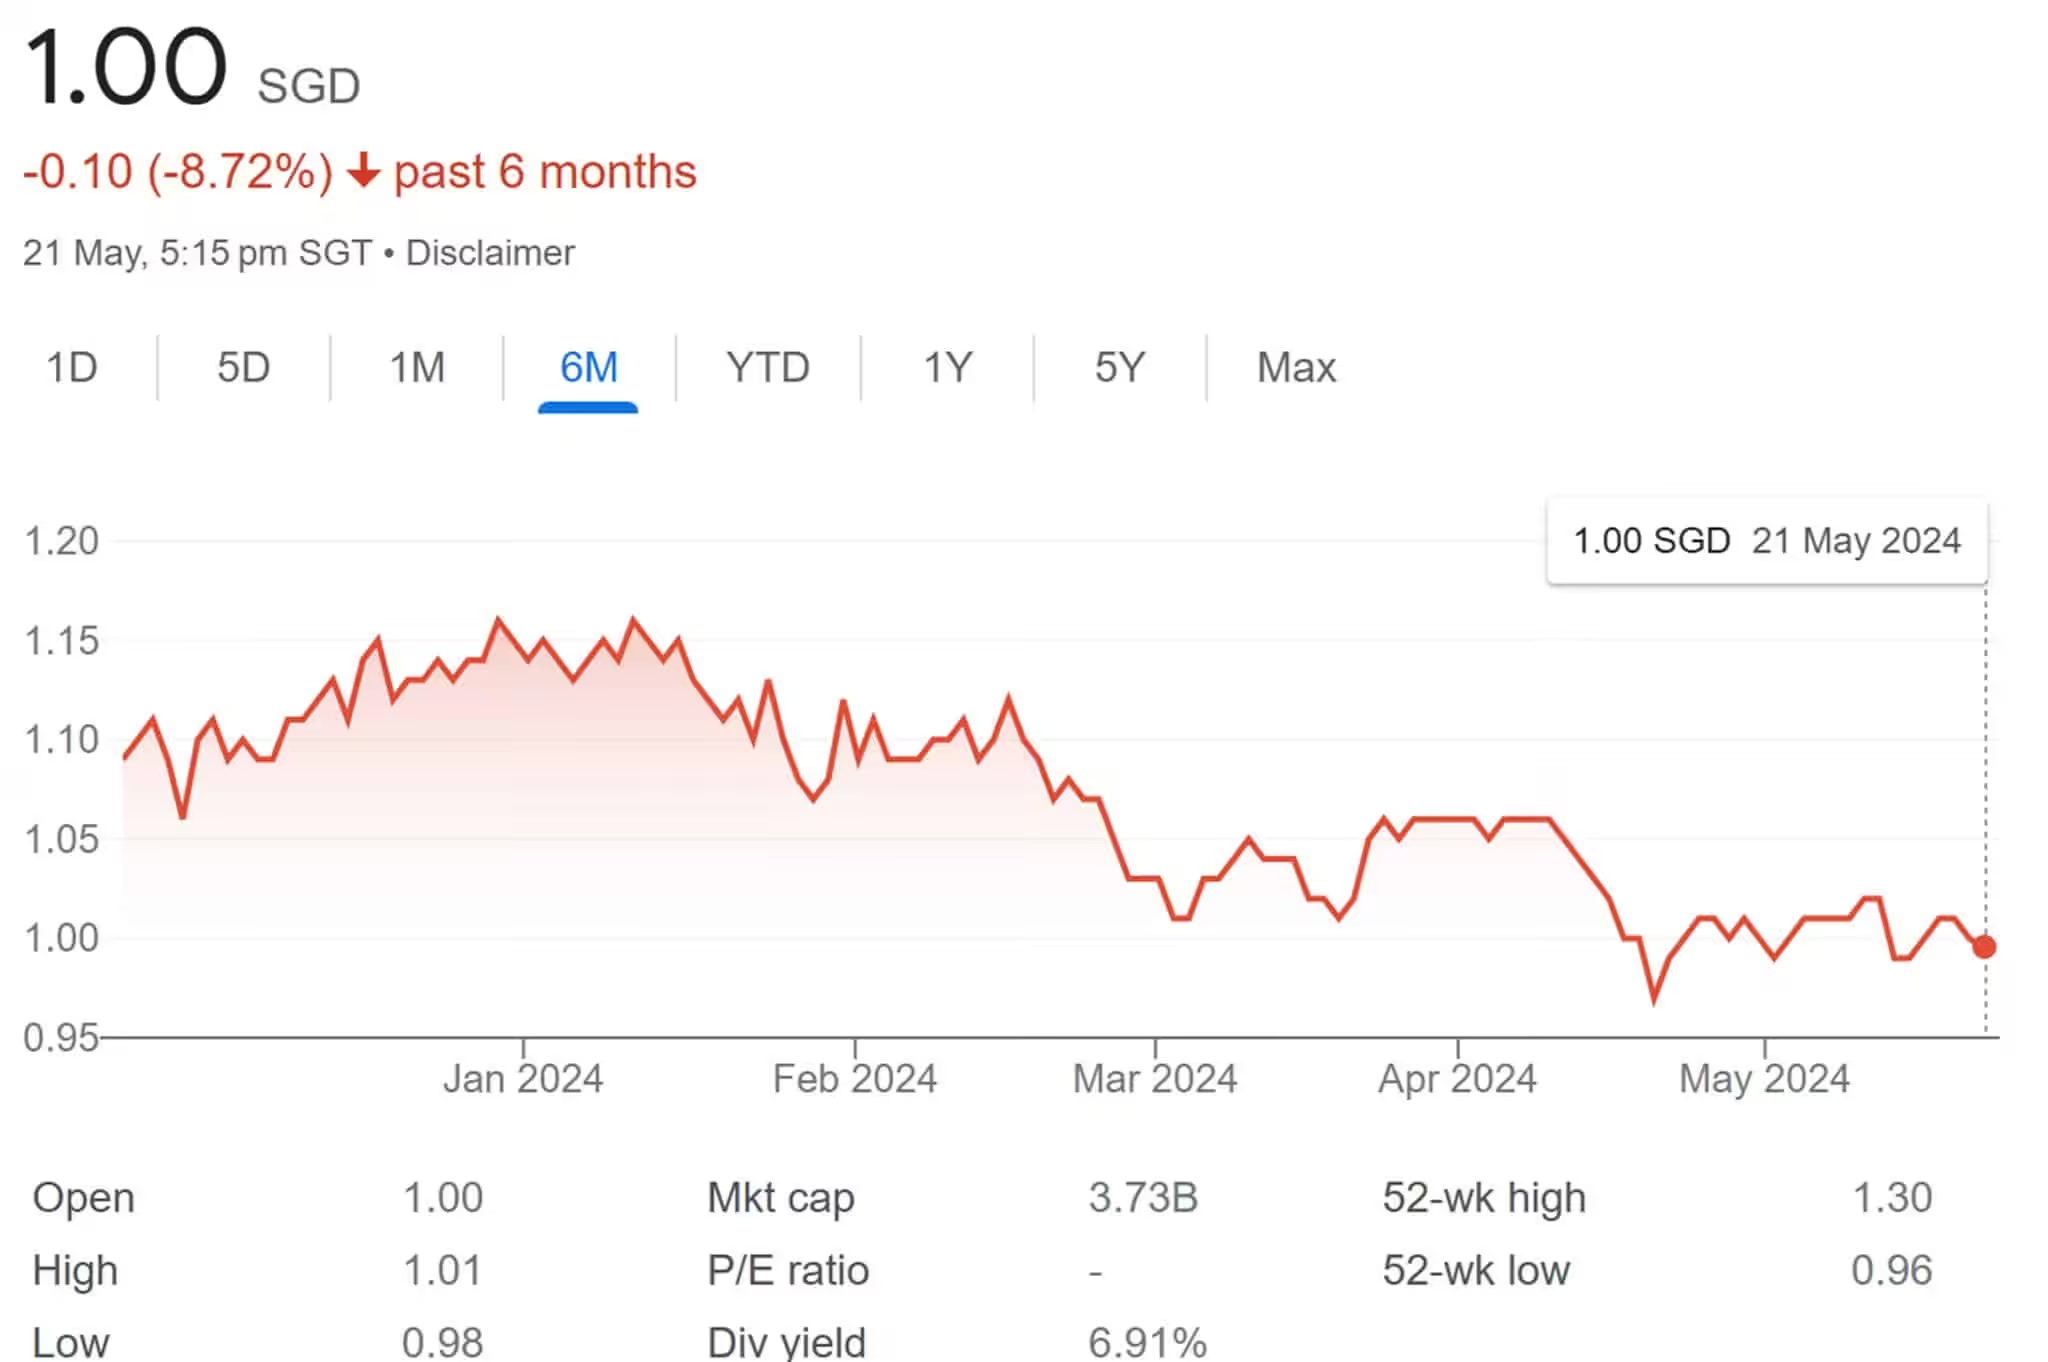
As you can see from the price chart above, the share price of Frasers Logistics and Commercial Trust has been on the downtrend. Based on the current closing price of S$1.00 and FY23 full year distribution of 7.04 cents, Frasers Logistics and Commercial Trust current dividend yield is 7.04%.
Summary of Frasers Logistics and Commercial Trust 1HFY24 Financial Results
Based on the latest financial results, the pros are
- Gross Revenue and Adjusted Net Property Income increased by 3.9% and 1.8% respectively.
- Aggregate leverage stood healthy at 32.7% with plenty of room for acquisitions.
- Overall portfolio occupancy stood healthy at 94.3%
- Well spread lease expiry.
- Positive rental reversion of 3.8%.
- High current dividend yield of 7.04%.
The cons are:
- Finance costs increased by 34.5% year-on-year.
- Occupancy for commercial segment continues to underperform.
- Distribution Per Unit (DPU) declined by 1.1% year-on-year to 3.48 cents.