
Keppel DC REIT, Singapore’s first pure‑play data centre REIT, continues to strengthen its position as a leading digital infrastructure landlord with assets across Asia Pacific and Europe. The REIT released its Second Half and Full Year 2025 financial results on 30 January 2026, providing investors with a detailed look at its performance amid a year of acquisitions, divestments, and portfolio optimisation.
The FY2025 results highlight the REIT’s strategic focus on hyperscale data centres, operational efficiency, and capital recycling. Despite market challenges, Keppel DC REIT delivered record distributions and strong rental reversions, supported by contributions from newly acquired assets and higher contract renewals.
Financial Performance
2HFY2025 Financial Results
| 2H FY2025 (S$’000) | 2H FY2024 (S$’000) | % Change | |
|---|---|---|---|
| Gross Revenue | 230,053 | 153,107 | +50.3% |
| Property Expenses | (29,606) | (25,470) | +16.2% |
| Net Property Income | 200,447 | 127,637 | +57.0% |
| Finance Income | 7,307 | 9,898 | (26.2%) |
| Finance Costs | (24,399) | (25,602) | (4.7%) |
| Distributable Income | 140,923 | 91,855 | +53.4% |
| Distribution Per Unit (DPU) (cents) | 5.248 | 4.902 | +7.1% |
| Adjusted DPU (cents) | 5.496 | 4.955 | +10.9% |
Full Year 2025 Financial Results
| FY2025 (S$’000) | FY2024 (S$’000) | % Change | |
|---|---|---|---|
| Gross Revenue | 441,362 | 310,287 | +42.2% |
| Property Expenses | (58,102) | (50,001) | +16.2% |
| Net Property Income | 383,260 | 260,286 | +47.2% |
| Finance Income | 15,311 | 15,390 | (0.5%) |
| Finance Costs | (48,943) | (51,509) | (5.0%) |
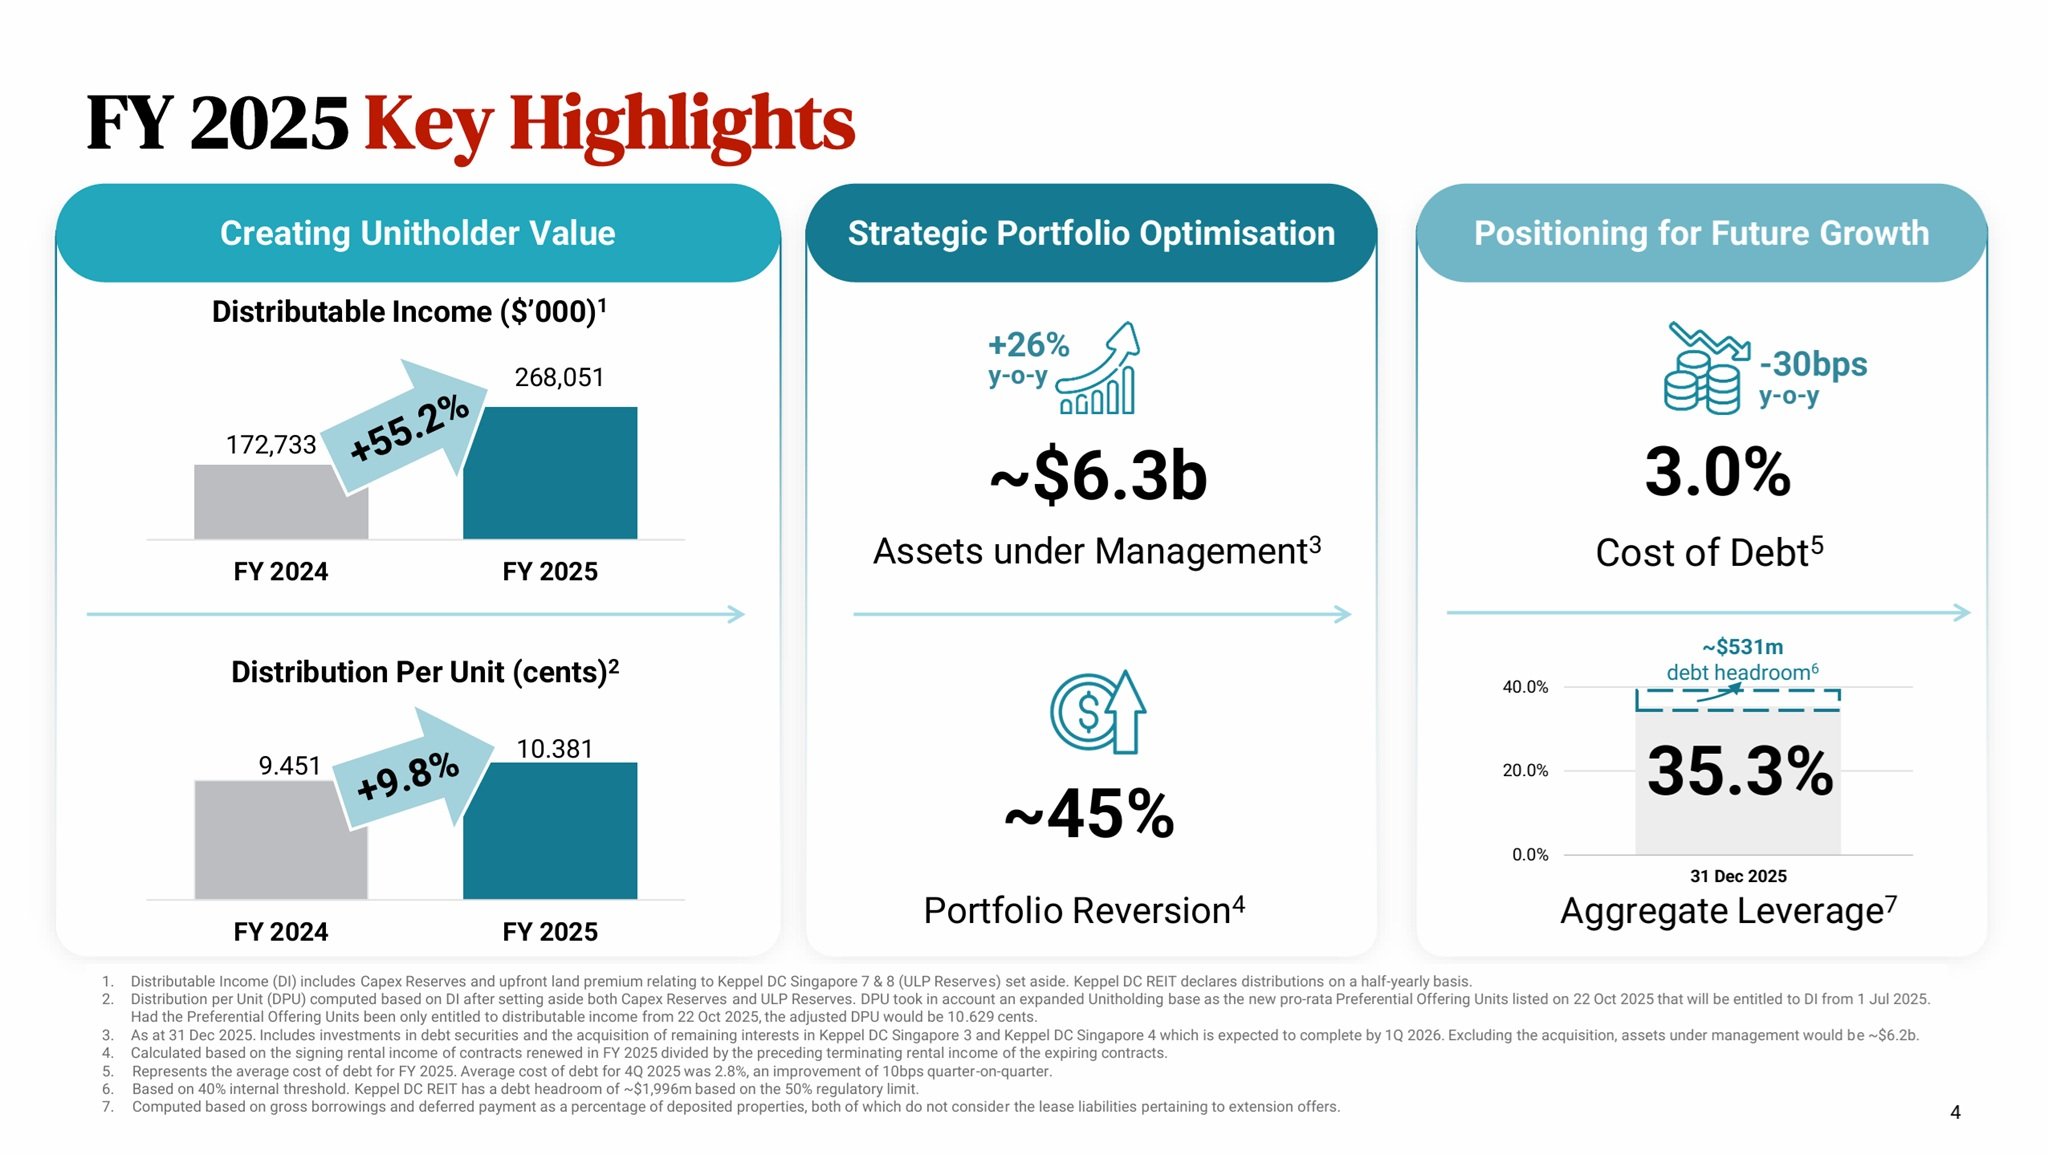
| Distributable Income | 268,051 | 172,733 | +55.2% |
| Distribution Per Unit (DPU) (cents) | 10.381 | 9.451 | +9.8% |
| Adjusted DPU (cents) | 10.629 | 9.504 | +11.8% |
Keppel DC REIT delivered a robust financial performance for FY2025, with gross revenue rising 42.2% year‑on‑year to S$441.4 million, driven primarily by contributions from Keppel DC Singapore 7 and 8, as well as Tokyo Data Centre 1 and 3. These acquisitions significantly boosted topline growth, although the divestments of Intellicentre Campus and Kelsterbach Data Centre partially offset the gains.
Net Property Income (NPI) also saw strong momentum, increasing 47.2% year‑on‑year to S$383.3 million. Distributable income for FY2025 rose 55.2% to S$268.1 million, supported by higher rental escalations and contract renewals. The REIT achieved a record Distribution Per Unit (DPU) of 10.381 cents, up 9.8% from the previous year, even after accounting for an enlarged unitholder base following the preferential offering in October 2025.
Debt
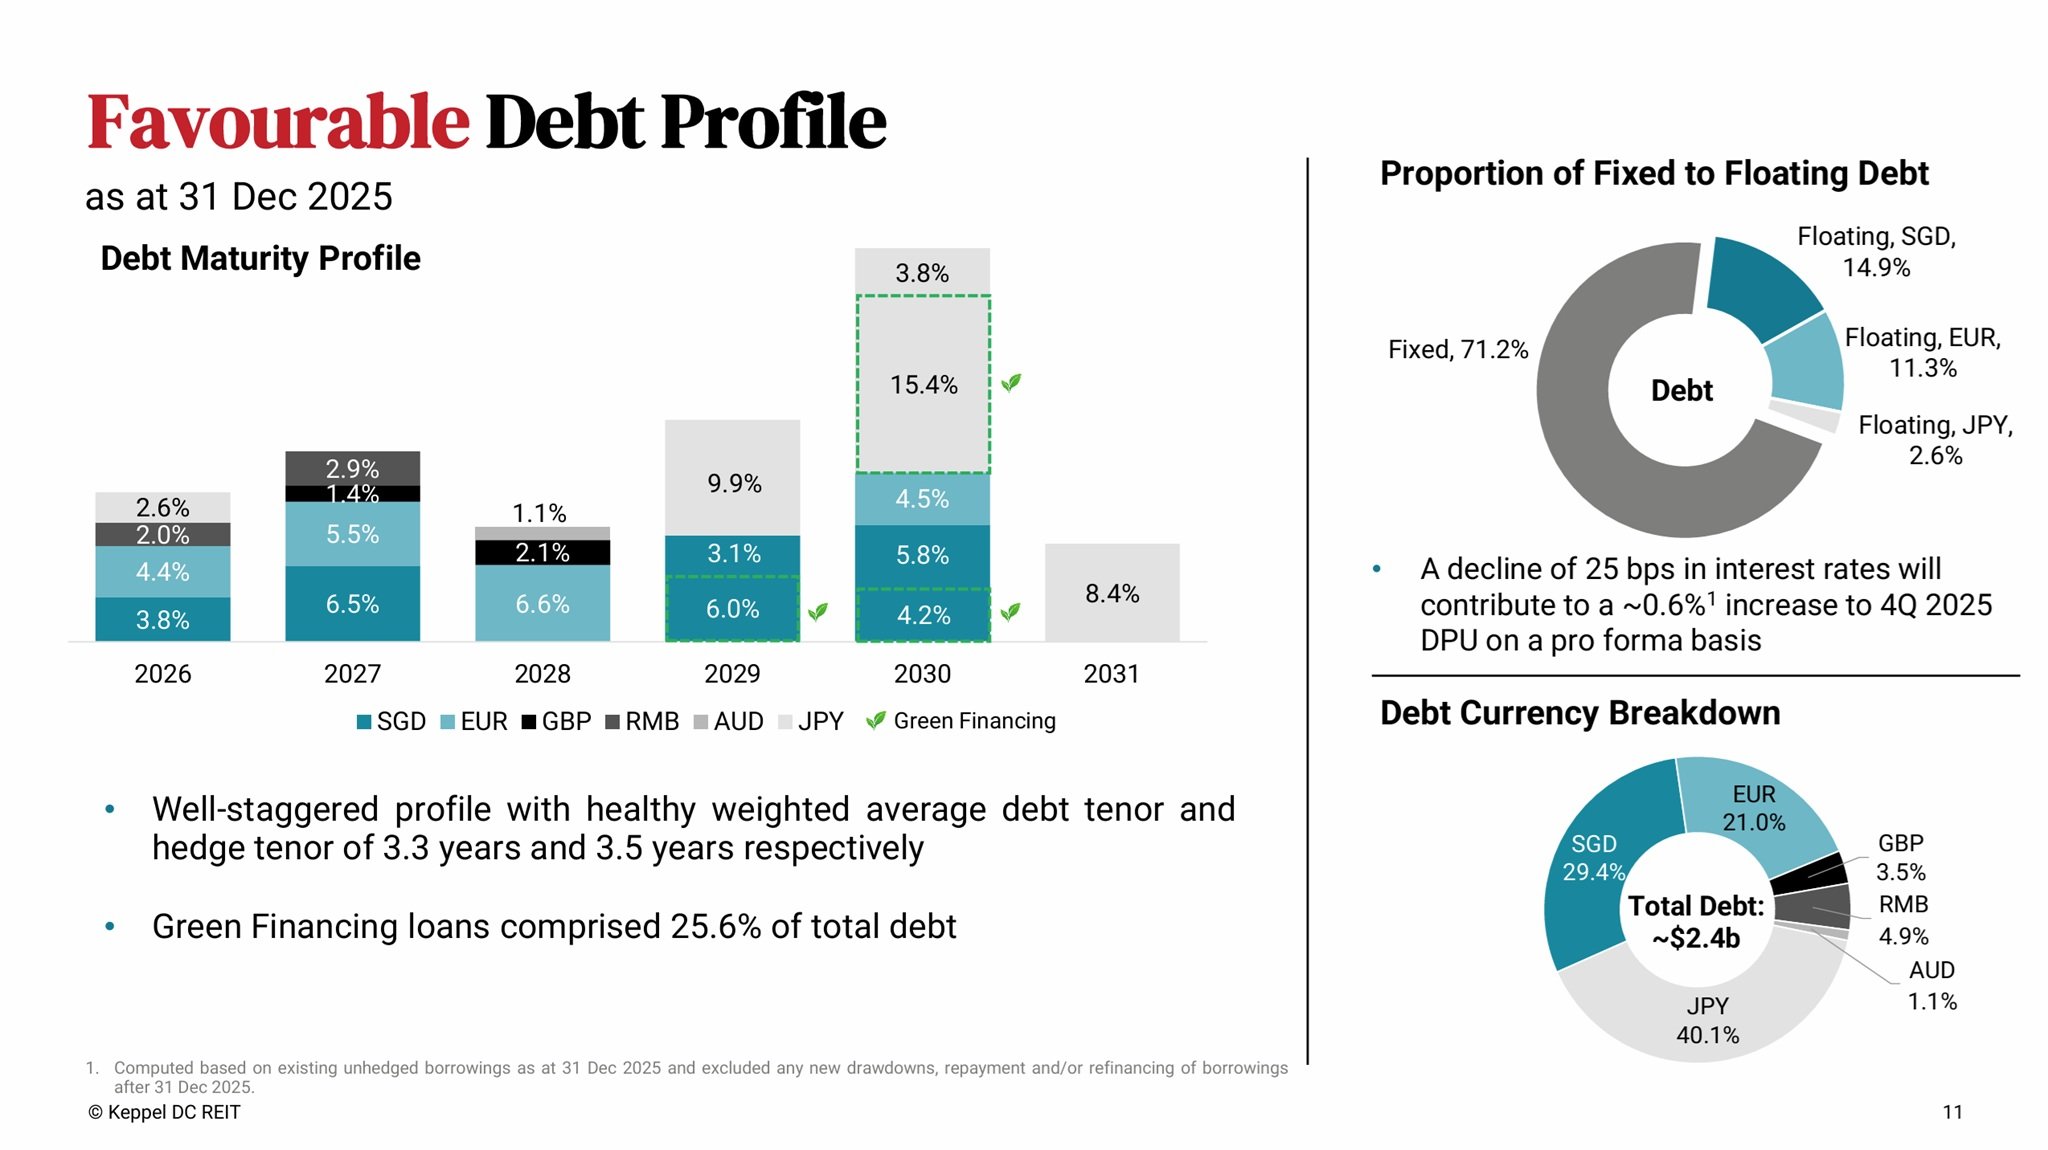
As of 31 December 2025, Keppel DC REIT maintained a healthy balance sheet with aggregate leverage at 35.3%, well below the regulatory limit and comfortably within its internal threshold. This gearing level provides approximately S$531 million of debt headroom for future acquisitions and asset enhancement initiatives.
The REIT also improved its financing efficiency, with the average cost of debt decreasing to 3.0% for FY2025, supported by favourable floating rates and active interest rate hedging. A total of 71.2% of borrowings were hedged, helping to mitigate interest rate volatility.
Occupancy

Portfolio occupancy remained resilient at 95.8% as of 31 December 2025, reflecting the mission‑critical nature of data centre assets and the REIT’s strong tenant relationships. Occupancy was stable quarter‑on‑quarter, supported by demand from hyperscalers and enterprise clients.
Singapore continued to be the REIT’s largest revenue contributor, while European markets such as Ireland and the Netherlands provided steady income streams. The stable occupancy underscores the REIT’s ability to maintain high utilisation across its diversified global portfolio.
Rental Reversions
FY2025 saw exceptionally strong rental reversions, with the REIT achieving +45% portfolio rental reversion for the year. This uplift was driven by renewals of colocation leases and higher‑value contracts across key markets.
However, rental reversion momentum in 4Q2025 was more modest at around 2%, due to the absence of major contract renewals during the quarter. Management noted that quarterly reversion figures can fluctuate depending on the mix of contracts up for renewal.
Lease Expiry
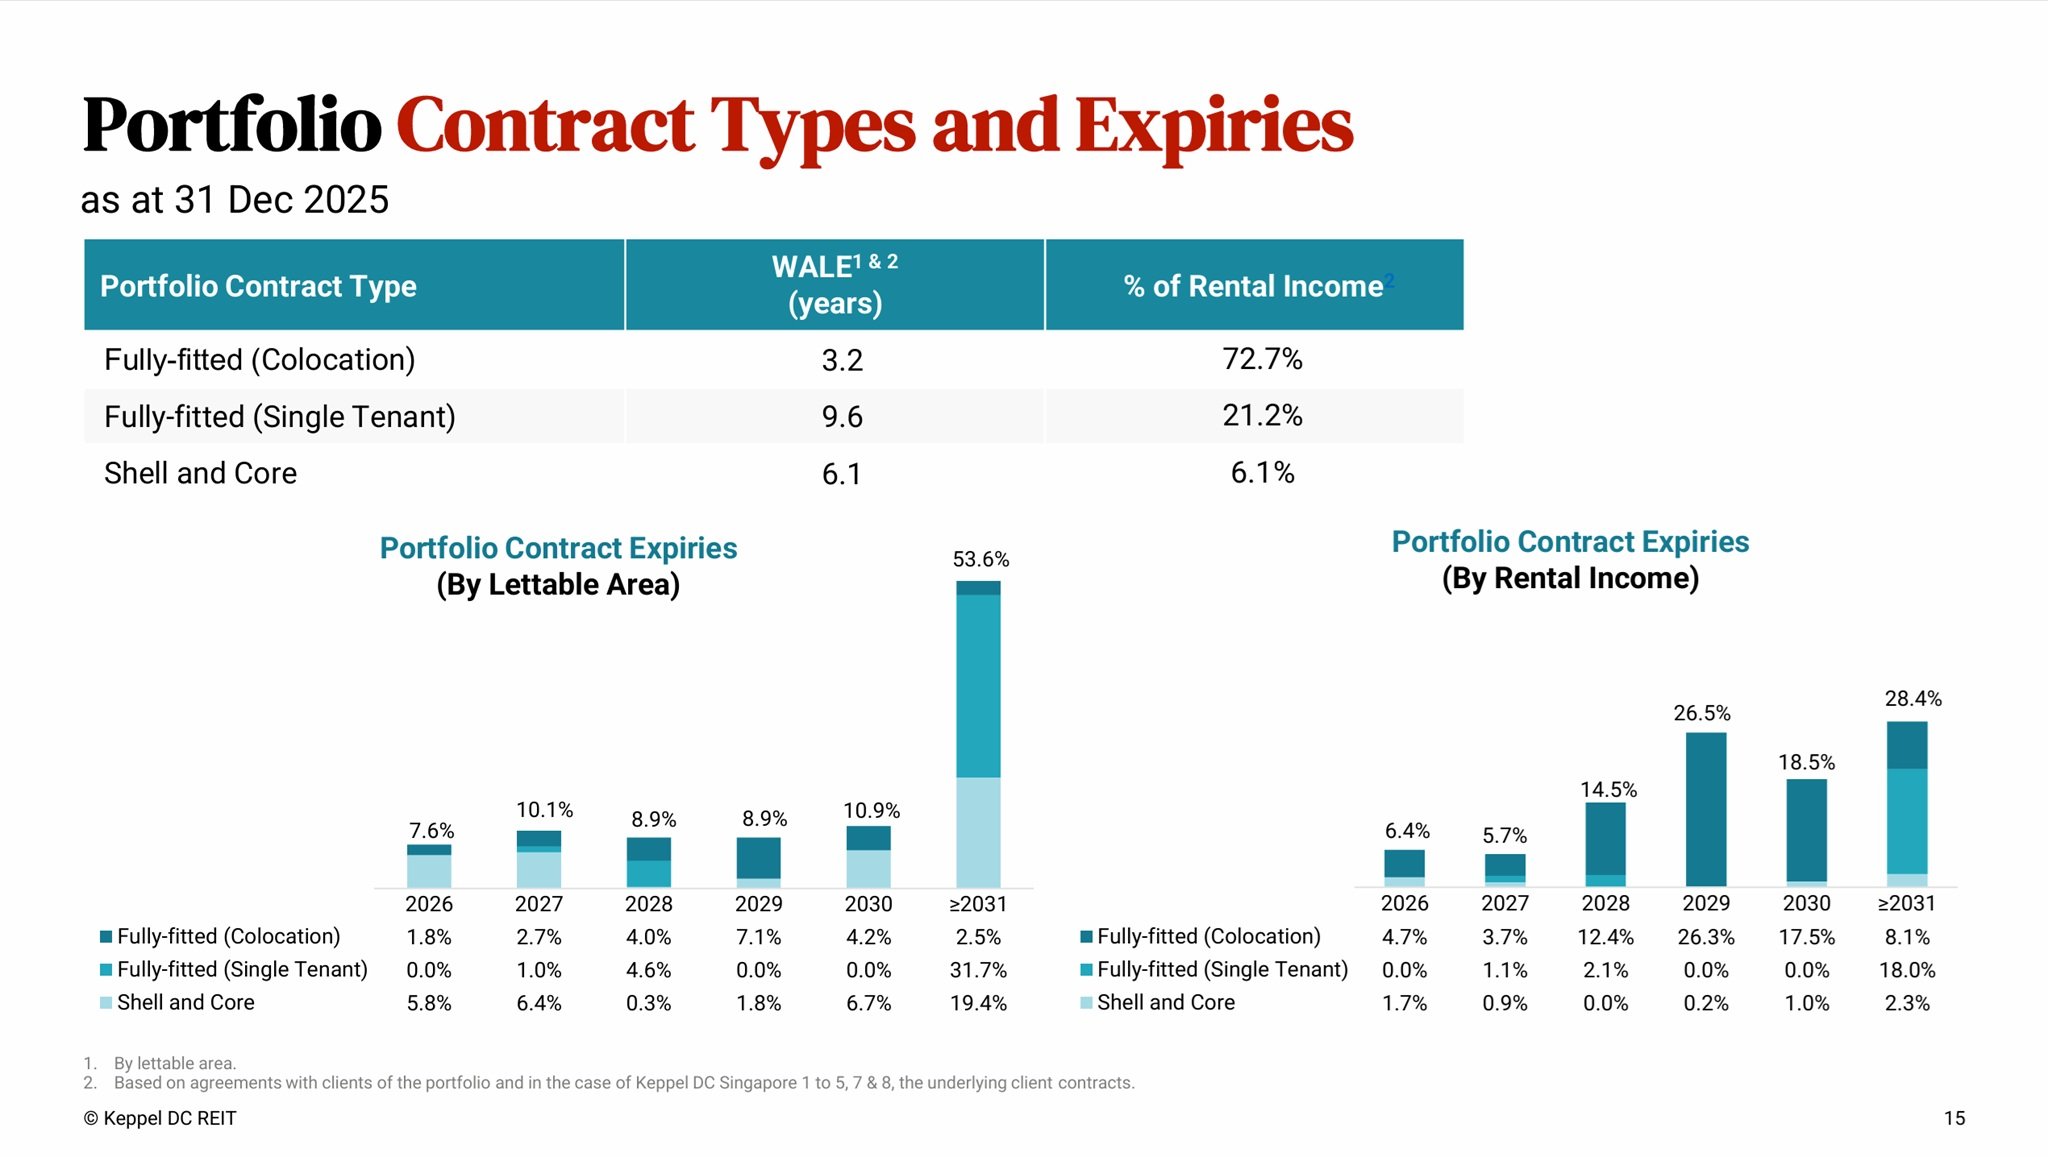
Keppel DC REIT maintains a well‑spread lease expiry profile, with only 7.6% of leases due for renewal in FY2026, providing strong income visibility. The REIT’s weighted average lease expiry (WALE) stood at 6.7 years, reflecting long‑term commitments from tenants, particularly hyperscalers.
Management continues to engage tenants proactively to secure renewals and explore expansion opportunities, ensuring stability and reducing concentration risk across the portfolio.
Keppel DC REIT Share Price and Current Dividend Yield
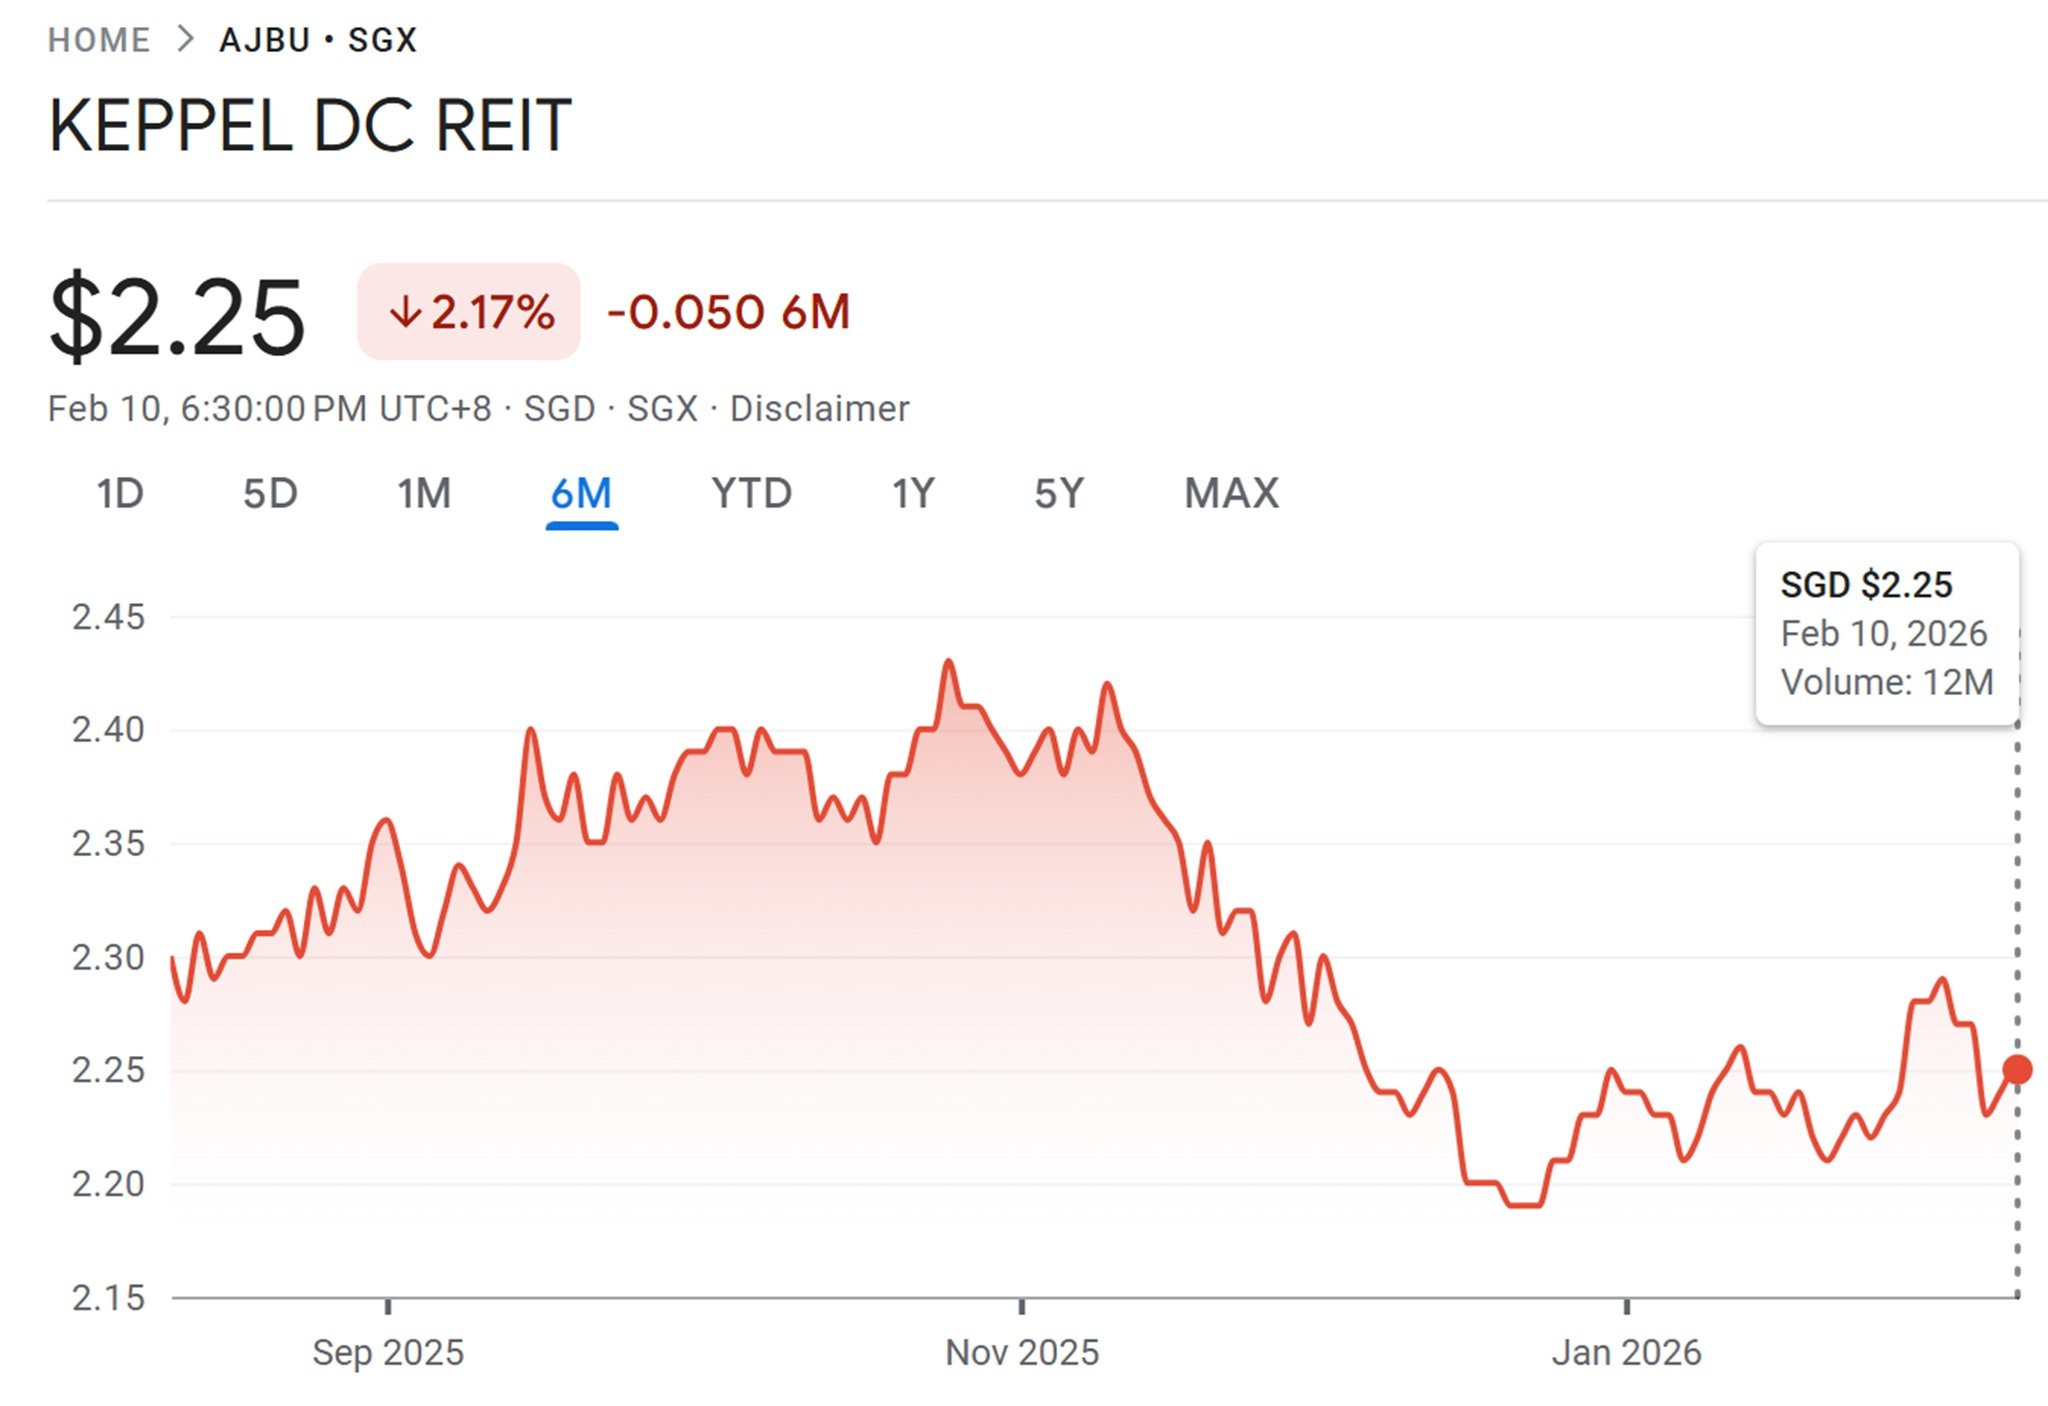
As of the latest available market data, Keppel DC REIT closed at S$2.25 per unit. Based on the FY2025 DPU of 10.381 cents, this translates to a current dividend yield of approximately 4.61%.
This yield remains attractive for income‑focused investors, especially given the REIT’s consistent track record of distribution growth and exposure to the fast‑expanding digital infrastructure sector.
Summary of Keppel DC REIT Second Half and Full Year 2025 Financial Results
We have come to the last section of this post. Again, let me summarize the pros and cons based on Keppel DC REIT’s second half and full year 2025 financial results. The pros are:
- Strong revenue and NPI growth driven by strategic acquisitions
- Record‑high DPU despite enlarged unitholder base
- Healthy gearing ratio with substantial debt headroom
- Stable occupancy at 95.8% with long WALE of 6.7 years
- Exceptional +45% rental reversions for FY2025
- Continued demand from hyperscalers and AI‑driven workloads
The cons are:
- Quarterly rental reversions may fluctuate depending on contract mix
- Divestments reduced contributions from certain markets
- Enlarged unit base creates ongoing dilution pressure
- Rising operational costs in some markets may affect margins