Frasers Logistics & Commercial Trust (FLCT) is one of Singapore’s largest and most globally diversified industrial and commercial REITs, with 113 properties across Australia, Europe, the UK, Singapore, and the Netherlands. On 3 February 2026, FLCT released its 1QFY26 Business Update, covering the period from 1 October to 31 December 2025. The update highlighted stable operational performance, strong leasing momentum, and prudent capital management amid a volatile macroeconomic environment.
In this article, we break down the key highlights of the update including debt metrics, occupancy, lease expiry profile, and the latest share price and dividend yield followed by a concise summary of pros and cons for investors.
Debt
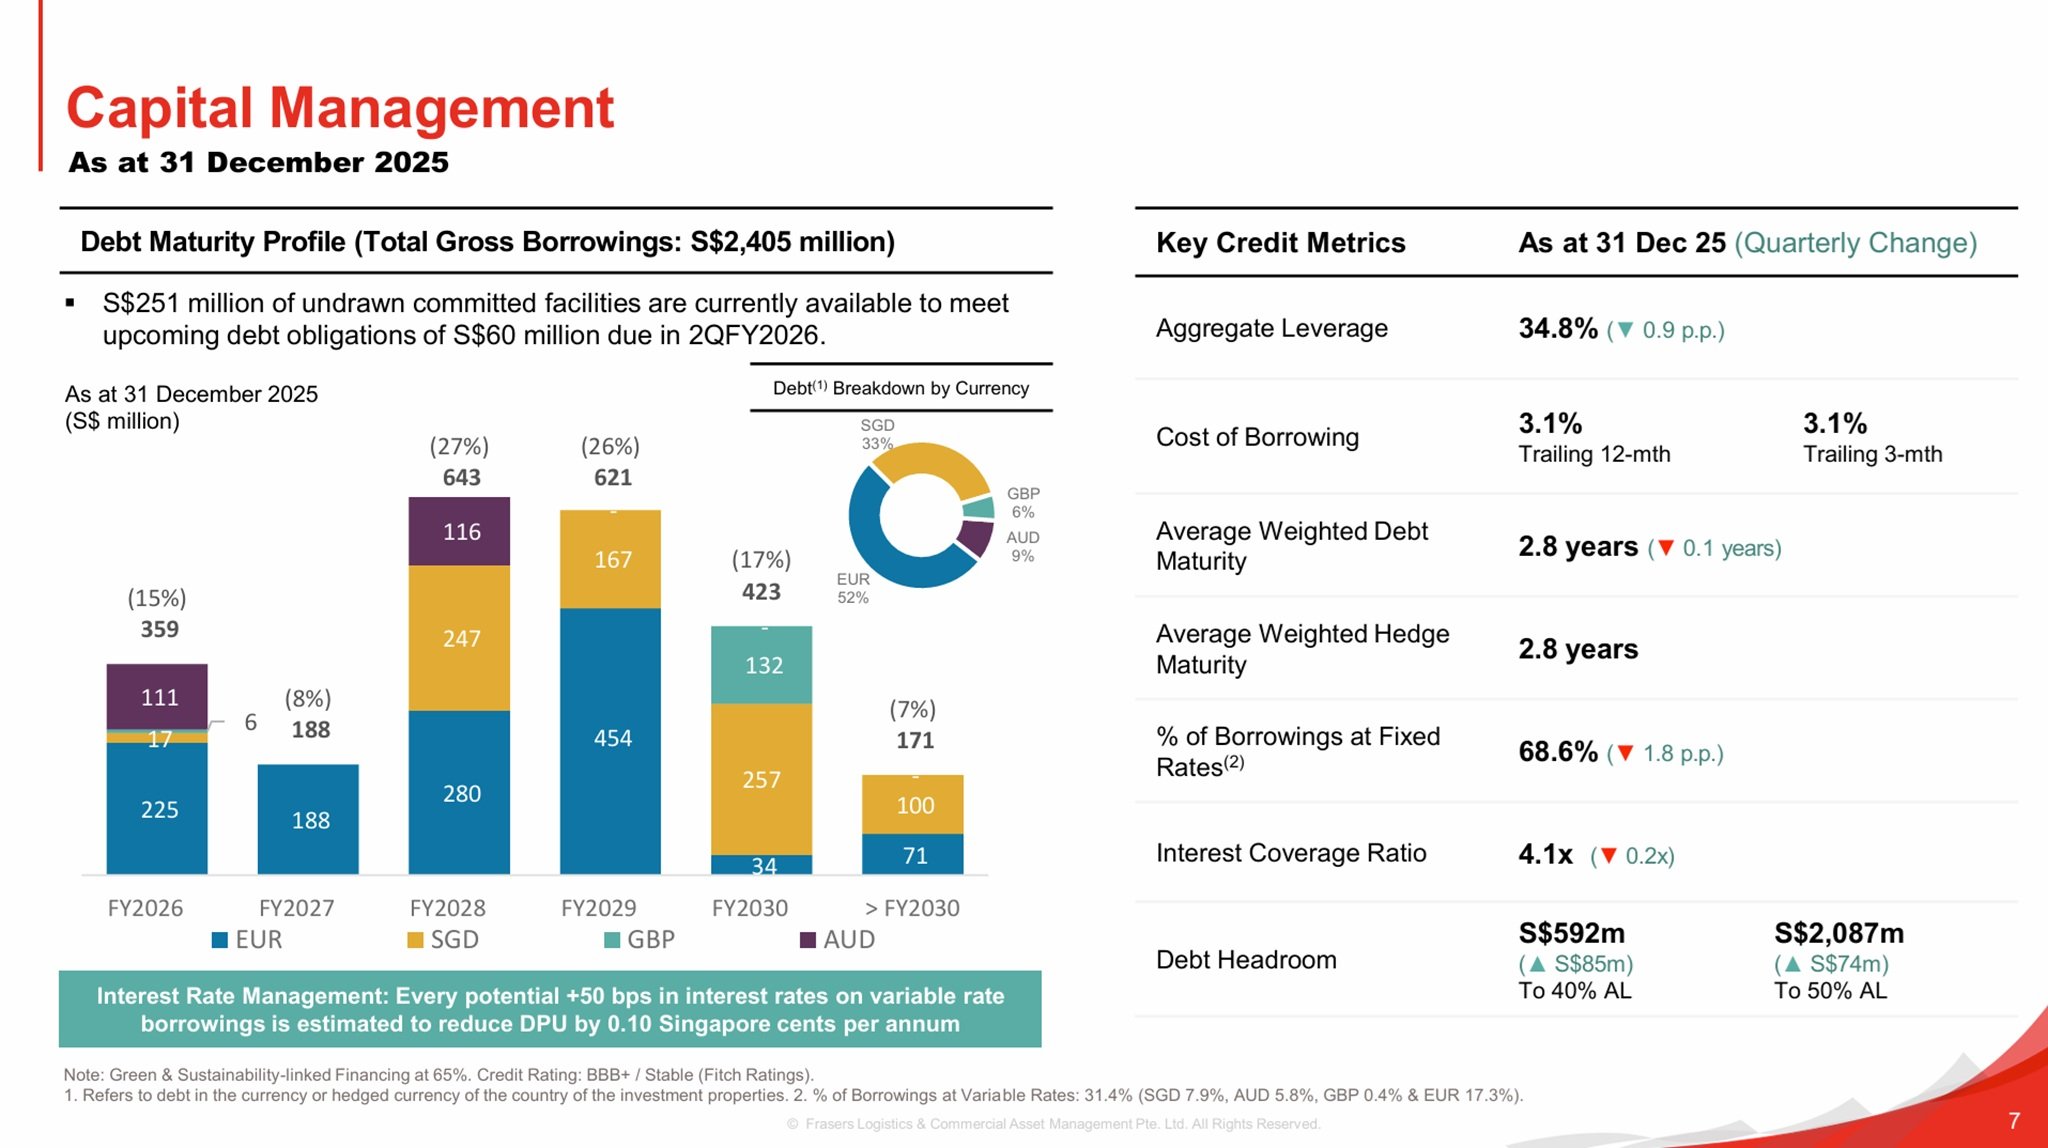
FLCT continues to demonstrate disciplined capital management, maintaining a healthy aggregate leverage of 34.8% as of 31st December 2025. This gearing level remains comfortably below the regulatory limit of 50%, giving the REIT ample flexibility for future acquisitions or asset enhancements. The trust also reported S$592 million of debt headroom before reaching 40% leverage, reinforcing its strong balance sheet position.
The REIT’s cost of borrowing remained stable at 3.1%, measured on both trailing 12‑month and 3‑month bases. Approximately 68.6% of borrowings are fixed, providing protection against interest rate volatility. FLCT also highlighted that every potential +50 bps increase in interest rates would reduce DPU by only 0.10 Singapore cents per annum, a manageable sensitivity that reflects prudent hedging practices.
Occupancy
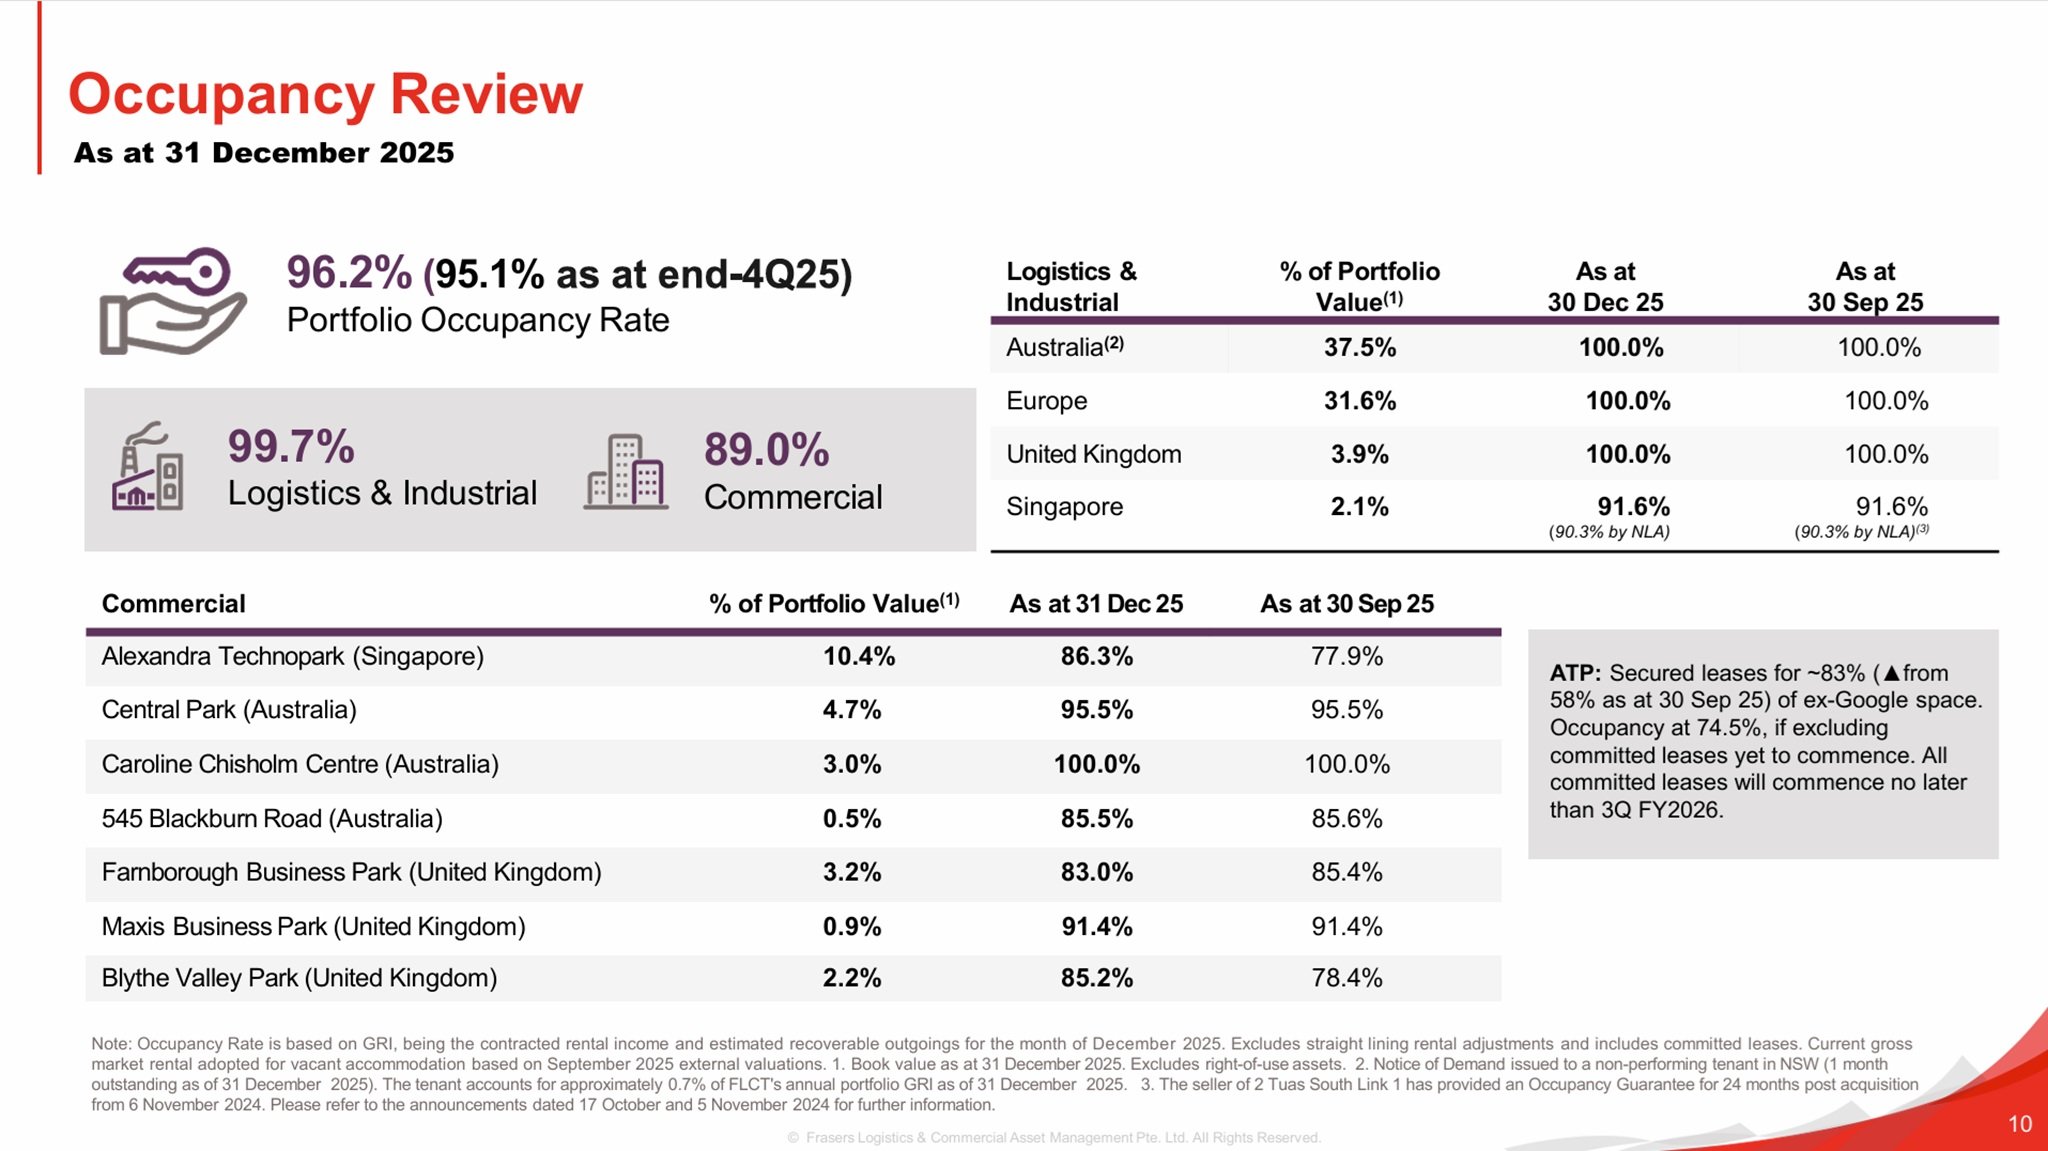
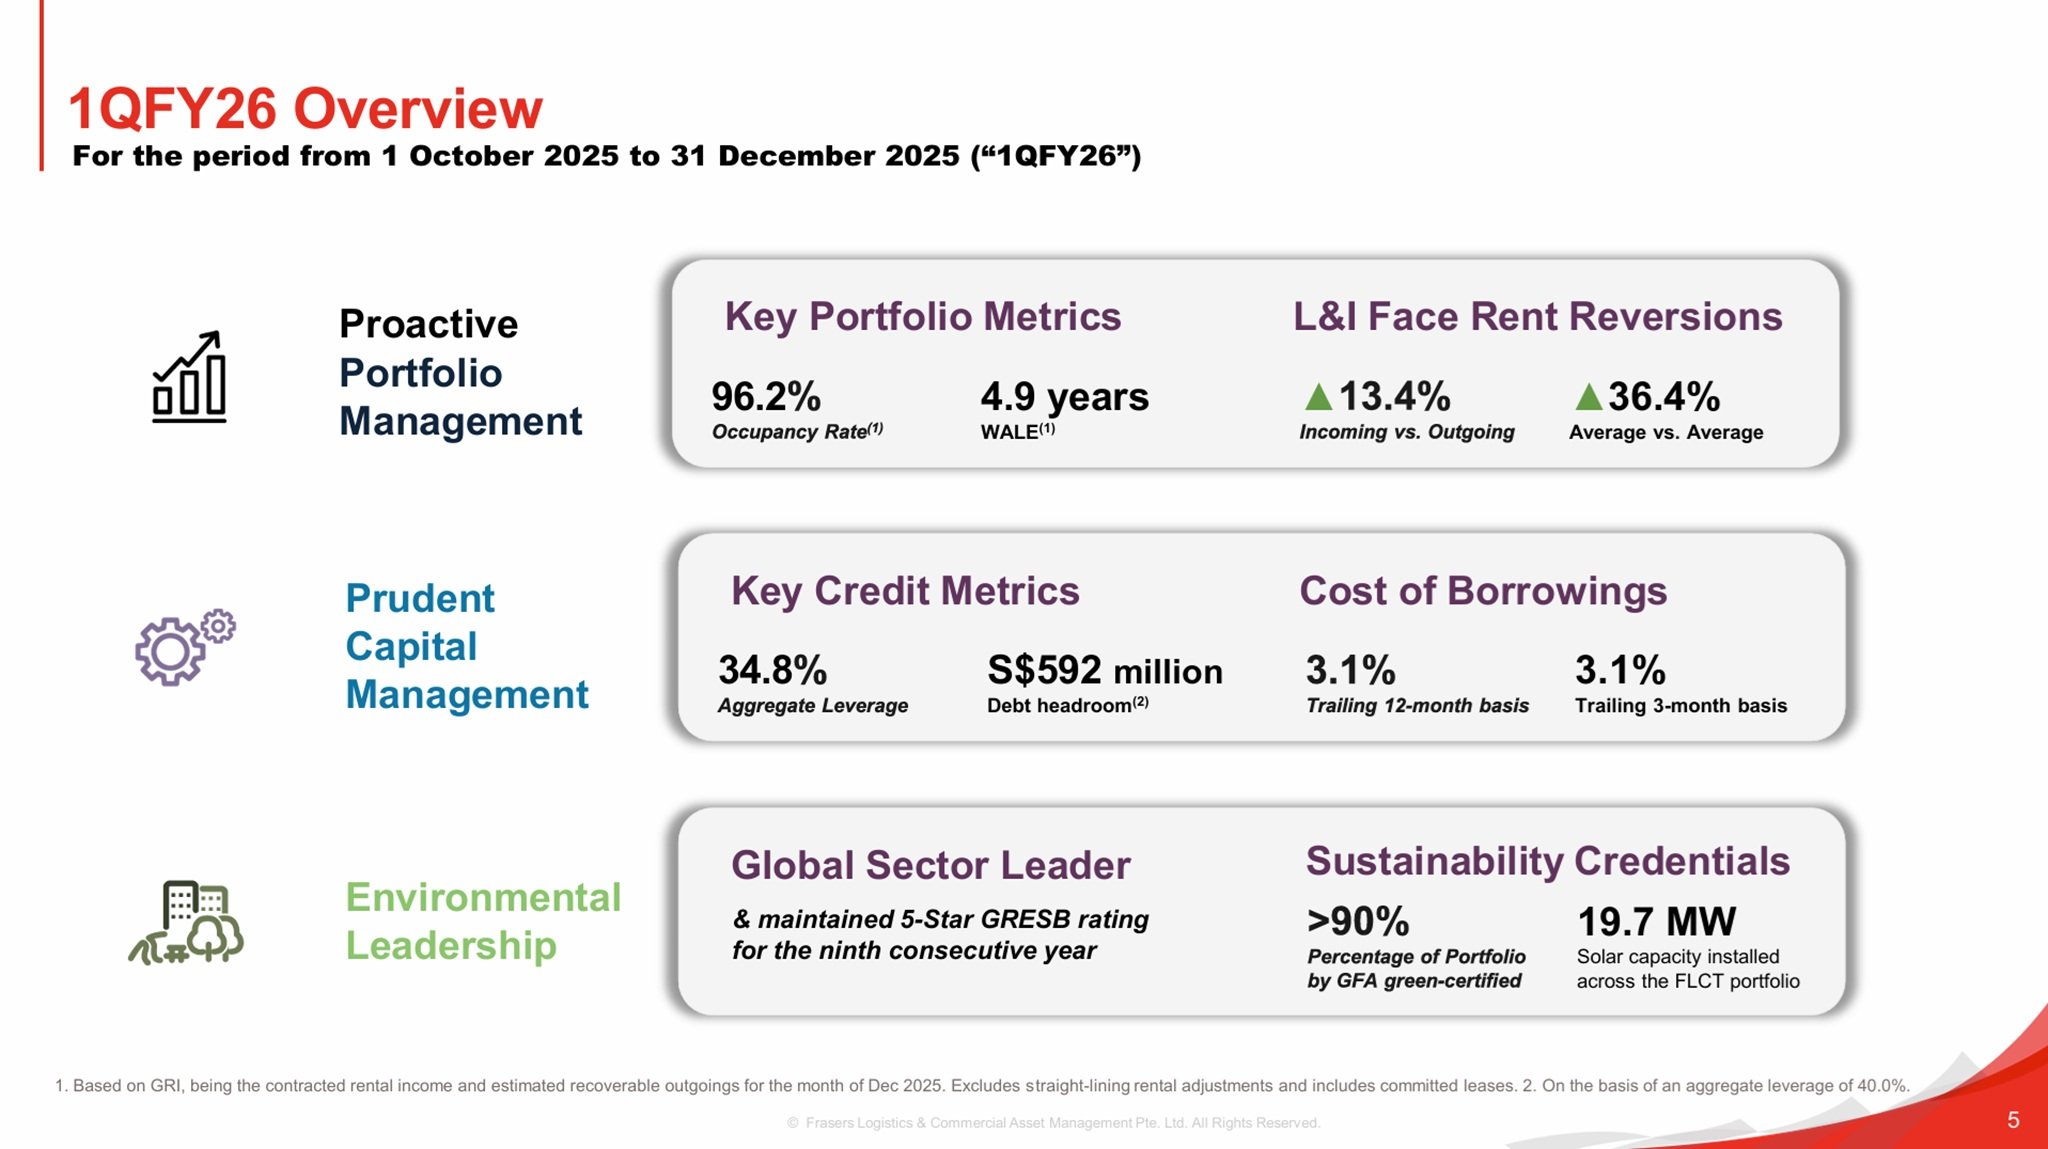
FLCT reported a portfolio occupancy rate of 96.2%, an improvement from 95.1% in the previous quarter. The logistics and industrial (L&I) segment which makes up 75% of portfolio value remained exceptionally strong with 99.7% occupancy, underscoring resilient demand for high‑quality logistics assets. This segment continues to benefit from structural tailwinds such as e‑commerce growth and supply chain diversification.
The commercial portfolio saw occupancy rise to 89.0%, supported by leasing progress at Alexandra Technopark (ATP). ATP secured leases for approximately 83% of the ex‑Google space, up from 58% in the previous quarter, with all committed leases commencing no later than 3Q FY2026. This demonstrates improving tenant confidence and successful repositioning efforts by the manager.
Lease Expiry
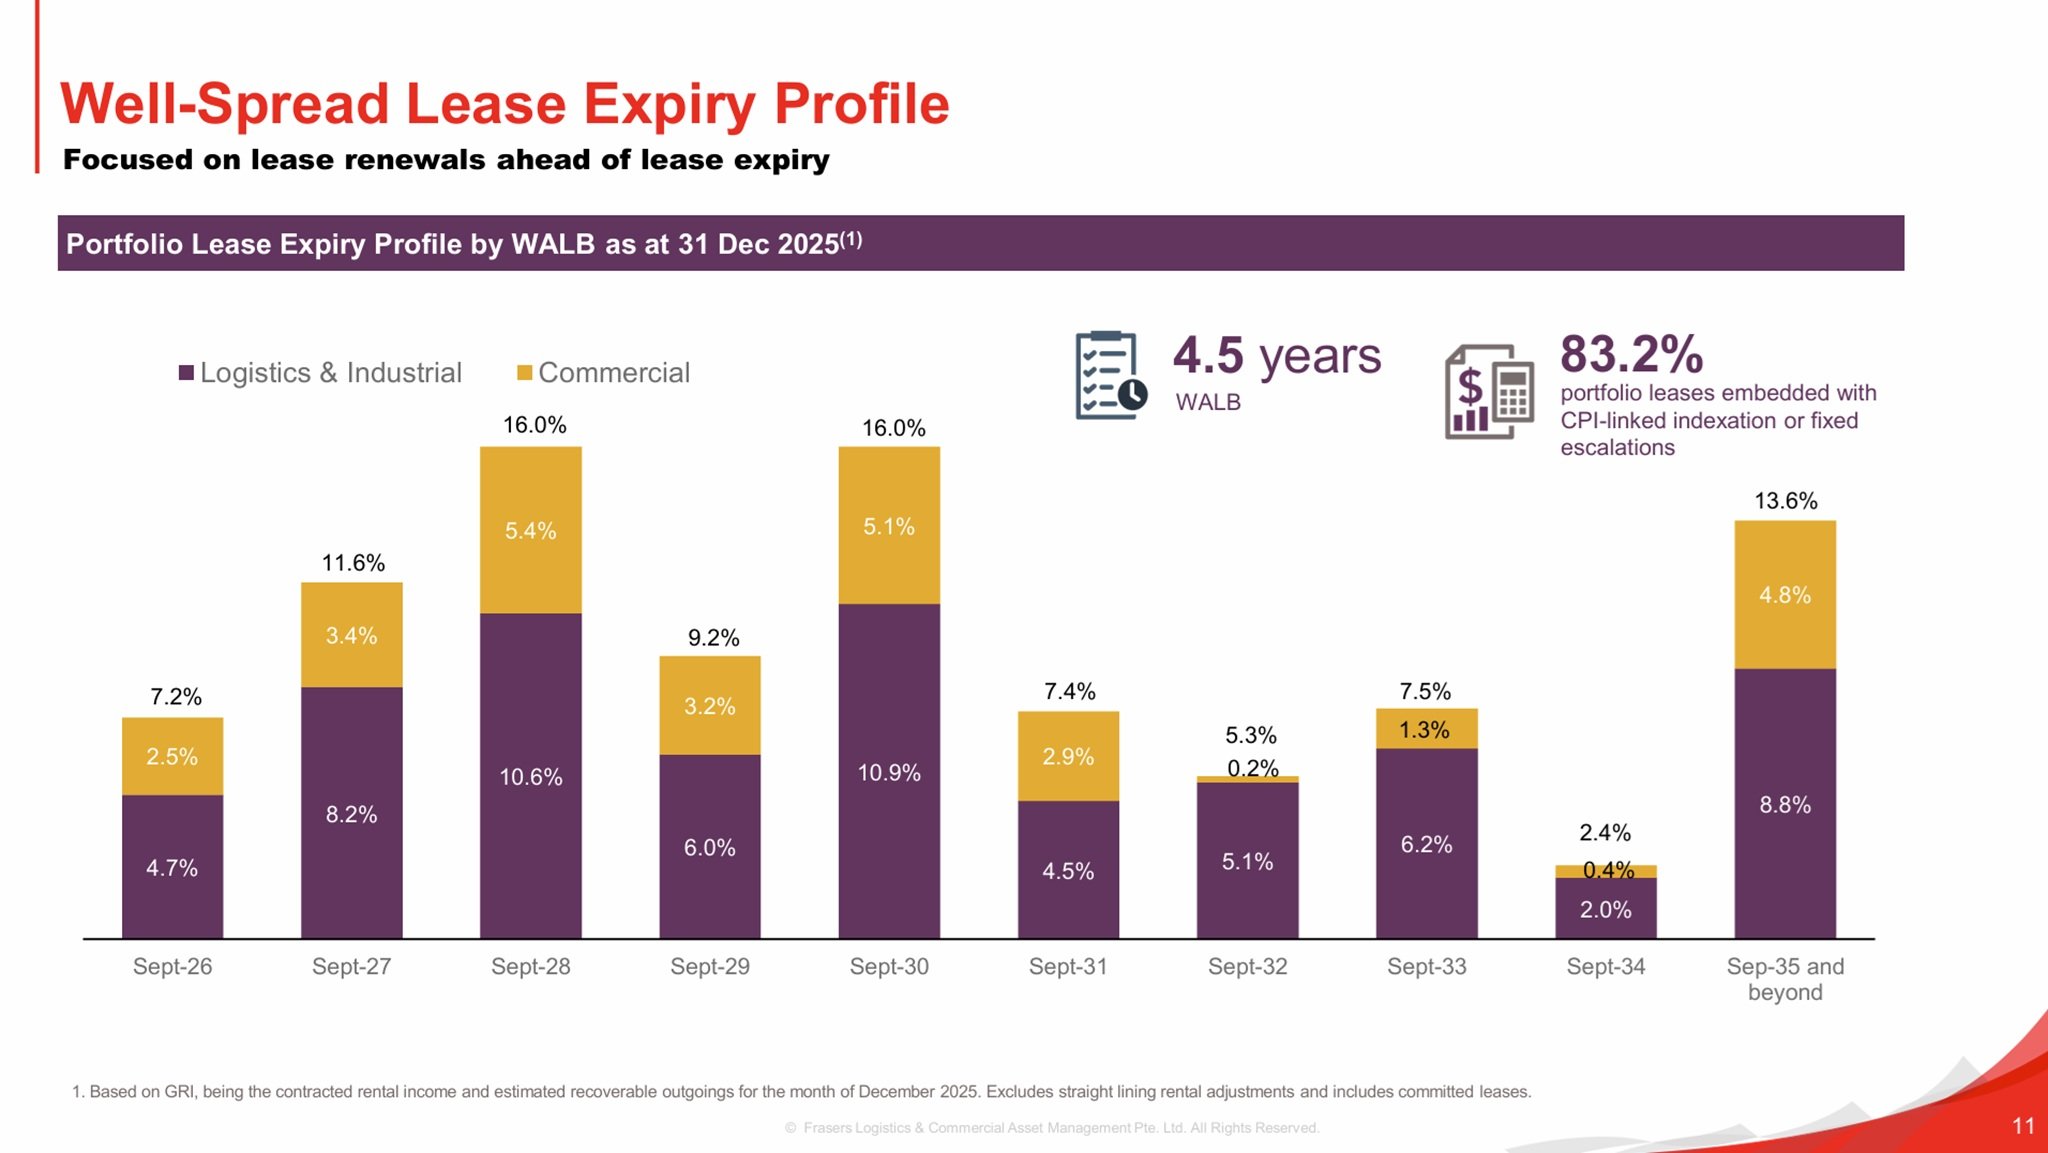
FLCT maintains a well‑spread lease expiry profile, reducing concentration risk and ensuring income stability. As of 31st December 2025, the portfolio’s WALB (Weighted Average Lease to Break) stood at 4.5 years, with 83.2% of leases embedded with CPI‑linked indexation or fixed escalations. This provides natural inflation protection, a valuable feature in today’s macroeconomic environment.
The logistics and industrial segment recorded a WALB of 4.5 years, while the commercial segment maintained a WALB of 4.3 years. The REIT’s proactive leasing strategy continues to focus on early renewals, tenant engagement, and securing long‑term commitments from high‑quality occupiers across resilient sectors.
Frasers Logistics and Commercial Trust Share Price and Dividend Yield
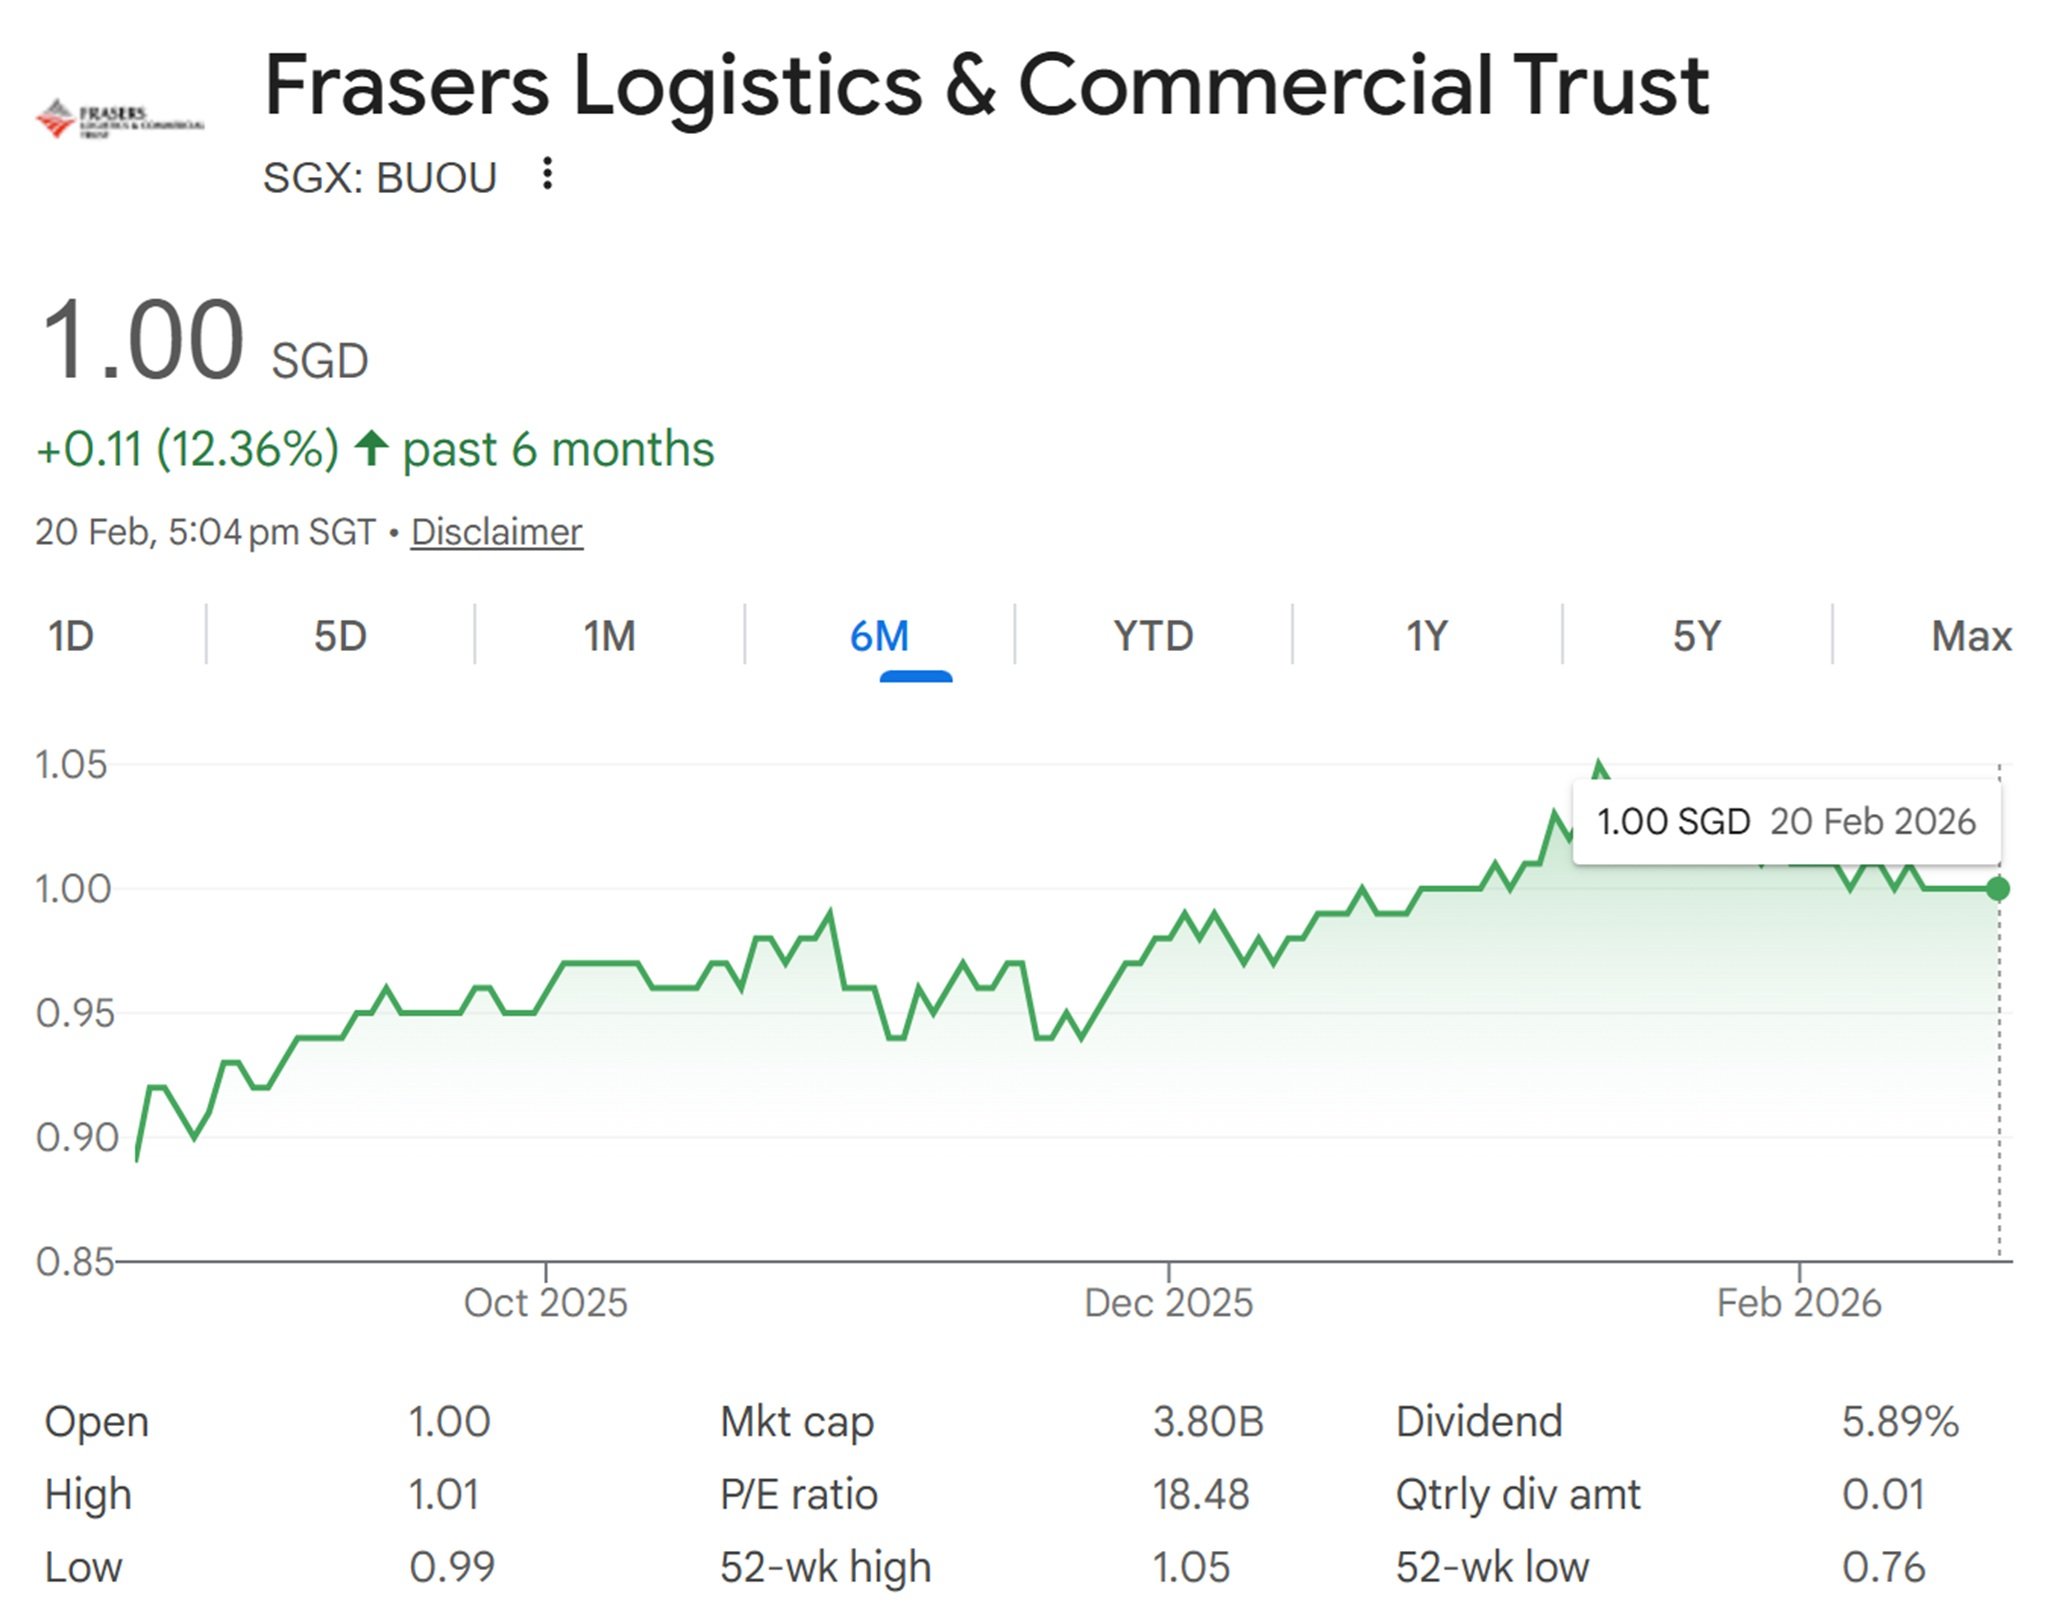
As of 20th February 2026, FLCT’s latest closing share price is S$1.00. Based on FY25 full year distribution of 5.95 cents and Frasers Logistics and Commercial Trust share price of S$1.00, this translates to a current dividend yield of 5.95%.
This yield remains attractive relative to other industrial REITs, especially considering FLCT’s strong occupancy, diversified tenant base, and inflation‑linked rental structures.
Summary of Frasers Logistics & Commercial Trust 1QFY26 Business Updates
Let me summarize the pros and cons. The pros are:
- Strong 96.2% portfolio occupancy, with L&I assets nearly fully occupied at 99.7%.
- Healthy aggregate leverage of 34.8%, providing ample debt headroom.
- Positive rental reversions in L&I segment: 13.4% incoming vs outgoing, 36.4% average vs average.
- Well diversified tenant base with no single tenant contributing more than 5% of GRI.
- High proportion of leases (83.2%) with CPI‑linked or fixed escalations, offering inflation protection.
- Continued progress in sustainability, with >90% of portfolio GFA green‑certified.
The cons are:
- Commercial segment rental reversions were negative at –3.3%, reflecting ongoing market softness.
- Some assets in the UK and Singapore commercial portfolio still face occupancy challenges.
- Interest rate sensitivity remains a factor, with rising rates potentially impacting DPU.
- A non‑performing tenant in NSW (0.7% of GRI) has been issued a Notice of Demand.