Table of Contents
The MPACT 2Q FY26/27 financial results, released on 30 October 2026, show a Singapore-anchored real estate investment trust (REIT) that is leaning heavily on VivoCity and lower interest costs to make up for weakness in its overseas properties. Mapletree Pan Asia Commercial Trust (MPACT) declared a distribution per unit (DPU) of 1.94 Singapore cents for the second quarter, which brings the total for the first half of the financial year (1H FY26/27) to 3.90 Singapore cents.
In this post, I walk through the key numbers for both the quarter and the half year, look at how each market performed, review the balance sheet and debt position, and share what I think income investors should keep an eye on over the next few quarters. If you missed the previous update, you can read my review of the MPACT 1Q FY26/27 financial results first.
MPACT 2Q FY26/27 Financial Results at a Glance
Here is a summary of the headline figures for the quarter ended 30 September 2026, compared against the same quarter a year ago. Note that these figures exclude The Pinnacle Gangnam in Seoul, because MPACT owns 50% of that building through a joint venture and only books its share of profit after tax.
| Metric | 2Q FY26/27 | 2Q FY25/26 | Change |
|---|---|---|---|
| Gross revenue | S$207.5 million | S$218.5 million | Down 5.0% |
| Property operating expenses | S$53.9 million | S$54.6 million | Down 1.2% |
| Net property income | S$153.5 million | S$163.9 million | Down 6.3% |
| Finance expenses | S$42.6 million | S$47.4 million | Down 10.1% |
| Amount available for distribution | S$103.1 million | S$106.2 million | Down 2.9% |
| Distribution per unit | 1.94 cents | 2.01 cents | Down 3.5% |
The pattern is easy to see. Net property income (NPI) fell by more than 6%, but because finance expenses dropped by about 10%, the decline in distributable income was cushioned to under 3%. The DPU fell slightly more than distributable income because the number of units in issue crept up a little over the year.
First Half FY26/27 Results
Zooming out to the six months from 1 April 2026 to 30 September 2026, the picture is very similar.
| Metric | 1H FY26/27 | 1H FY25/26 | Change |
|---|---|---|---|
| Gross revenue | S$413.9 million | S$437.1 million | Down 5.3% |
| Net property income | S$308.3 million | S$329.9 million | Down 6.5% |
| Finance expenses | S$83.4 million | S$97.4 million | Down 14.4% |
| Amount available for distribution | S$207.3 million | S$213.0 million | Down 2.7% |
| Distribution per unit | 3.90 cents | 4.02 cents | Down 3.0% |
Singapore gross revenue actually grew by 1.2% year-on-year for the half, so the entire decline came from overseas. Three things drove it. First, the Fujitsu Makuhari Building in Japan lost its main tenant, which the manager had flagged earlier. Second, China and Hong Kong remained difficult markets. Third, MPACT no longer earns income from the three assets it sold during the past year: TS Ikebukuro Building and ABAS Shin-Yokohama Building in Japan, and the office tower at Festival Walk in Hong Kong. A stronger Singapore dollar against the Japanese yen and Hong Kong dollar also trimmed overseas income when converted back into Singapore dollars.
The silver lining from those divestments is that the sale proceeds were used to pay down debt. That, together with lower Singapore dollar interest rates, is why finance expenses fell so sharply. In my view, this is the most important theme of the MPACT 2Q FY26/27 financial results: the REIT has traded some rental income for a lighter interest bill, and so far the trade has softened the hit to distributions.
VivoCity Remains the Star Performer
VivoCity continues to be the engine of this REIT. On a like-for-like basis, the mall’s gross revenue rose 5.9% and its NPI rose 5.0% in the second quarter. For the half year, revenue was up 7.5% and NPI was up 6.9%. VivoCity alone contributed about S$98.2 million of NPI in the first half, more than any other single property in the portfolio.
The improvement comes largely from the completed Basement 2 asset enhancement initiative, which added new retail space and brought in fresh tenants. VivoCity is fully committed at 100% occupancy, and leases renewed or re-let during the half year achieved a rental reversion of 15.0%. In plain terms, new and renewed leases are being signed at rents about 15% higher than the expiring ones, which is a strong result for a Singapore mall.
Tenant sales grew 3.3% year-on-year in the quarter and 4.1% for the half. Shopper traffic was only marginally higher. The manager pointed to changes around the HarbourFront precinct, including the opening of the final stage of the Circle Line in July 2026 and the closure of HarbourFront Centre later that month, as factors affecting footfall. I think the Circle Line completion could be a long-term positive, as it gives VivoCity a more direct link to the city centre, but it is worth watching whether shopper traffic picks up in the coming quarters.
Mapletree Business City: Better Days Ahead
Mapletree Business City (MBC) was the soft spot in Singapore this half. Its revenue and NPI declined because of transitional vacancy between tenants and lower one-off compensation income compared to last year. On a like-for-like basis, MBC’s half-year NPI fell from S$92.8 million to S$87.3 million.
The good news is that committed occupancy at MBC climbed to 95.4%, up from 94.3% in June and 93.0% a year ago. Several key committed leases are scheduled to start paying rent progressively from the third quarter of FY26/27. Rental reversion at MBC was a modest but positive 1.4%. If these new leases kick in as planned, MBC should go from being a drag to a contributor over the second half of the financial year.
Among the other Singapore properties, Bank of America HarbourFront remains fully occupied, while mTower is still backfilling space after some tenants moved out. Together, the other Singapore properties achieved a rental reversion of 5.5%.
Overseas Properties: Occupancy Over Rent
Outside Singapore, the strategy is clearly about keeping buildings occupied, even if that means accepting lower rents. The table below shows committed occupancy across the portfolio and the rental reversion achieved on leases expiring in FY26/27.
| Property or market | Committed occupancy (30 September 2026) | Committed occupancy (30 June 2026) | Rental reversion (1H FY26/27) |
|---|---|---|---|
| Mapletree Business City, Singapore | 95.4% | 94.3% | +1.4% |
| VivoCity, Singapore | 100.0% | 99.7% | +15.0% |
| Other Singapore properties | 95.4% | 95.3% | +5.5% |
| Festival Walk, Hong Kong | 99.9% | 98.5% | -15.6% |
| China properties | 84.5% | 82.4% | -29.9% |
| Japan properties | 57.5% | 56.0% | +2.4% |
| The Pinnacle Gangnam, South Korea | 99.9% | 99.9% | +32.7% |
| Total portfolio | 85.6% | 84.4% | +3.5% |
Festival Walk in Hong Kong is almost fully let, and tenant sales rose 3.7% in the quarter with shopper traffic up more than 10%. Spending on luxury items and the arrival of new tenants helped. However, rental reversion was negative 15.6%, because leases signed during stronger times are being renewed at today’s lower market rents. Hong Kong retail is improving at the margin, but rents have not yet caught up.
China is the weakest market. Occupancy at Gateway Plaza in Beijing and Sandhill Plaza in Shanghai improved slightly to 84.5%, but the rental reversion of nearly negative 30% shows how much landlords are cutting rents to keep tenants. Both cities continue to face a large supply of new office and business park space.
Japan’s committed occupancy of 57.5% looks alarming, but it is mostly about one building. The Fujitsu Makuhari Building in Chiba lost its anchor tenant, and the Makuhari area has a high vacancy rate. The Tokyo buildings remain stable. Meanwhile, The Pinnacle Gangnam in Seoul is the overseas bright spot, with near-full occupancy and a rental reversion above 32%.
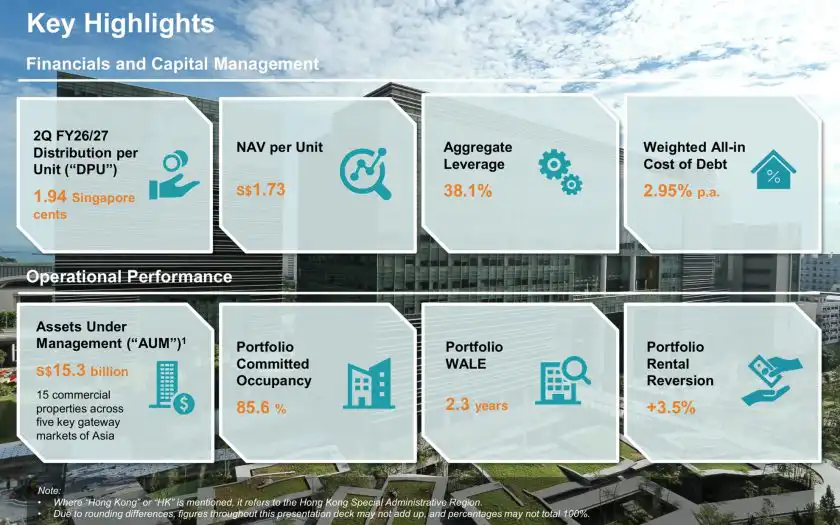
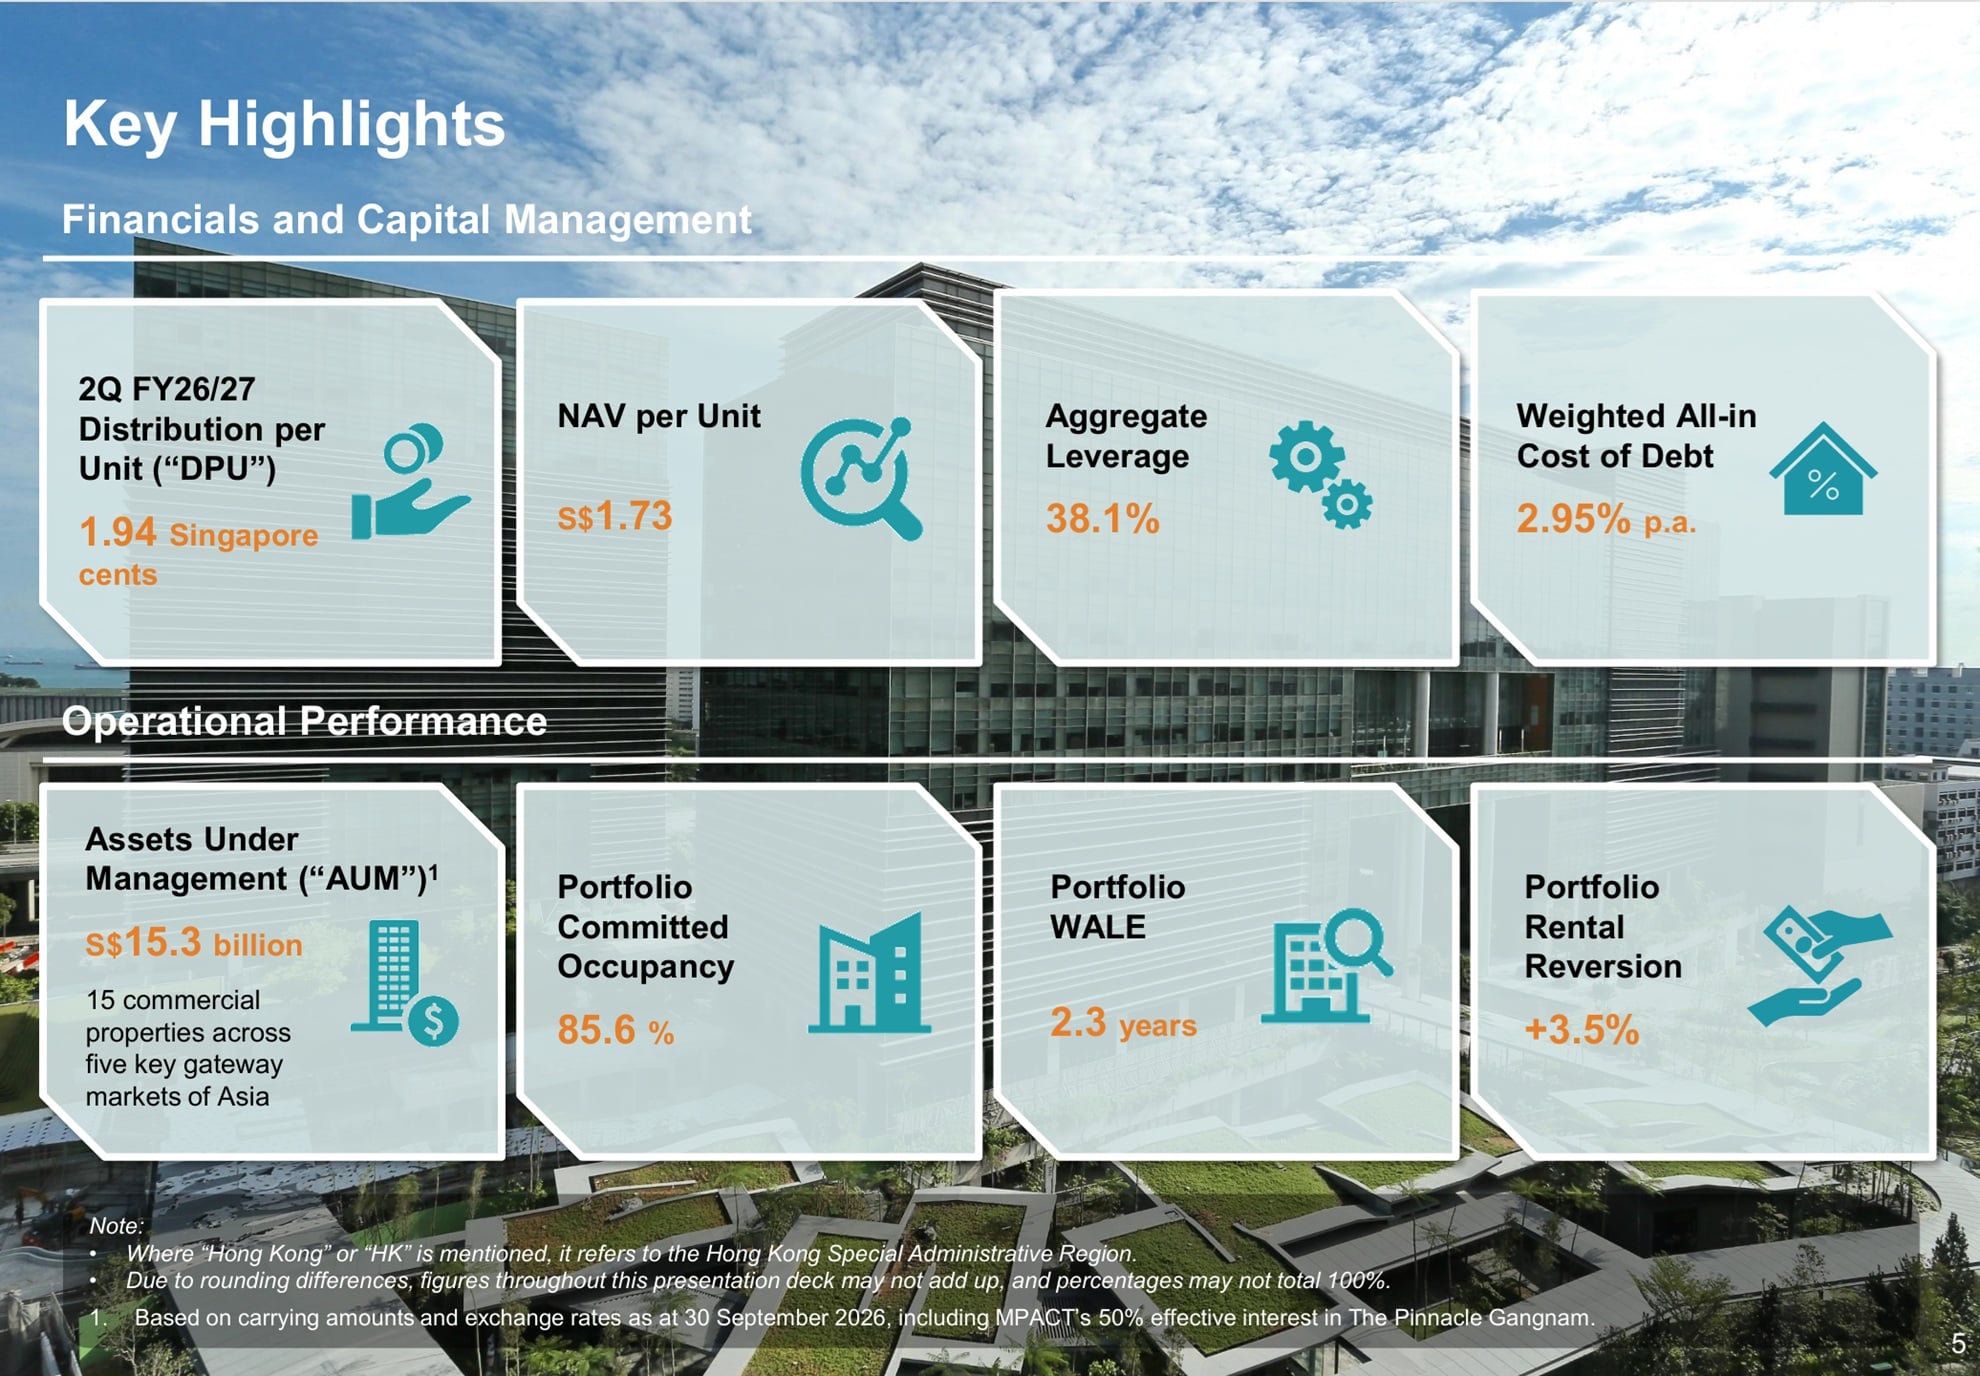
Across the whole portfolio, committed occupancy rose 1.2 percentage points quarter-on-quarter to 85.6%, and the overall rental reversion was a positive 3.5%. The weighted average lease expiry was 2.3 years, which is fairly short and means rents get reset frequently, for better or for worse.
Balance Sheet and Debt Position
Net asset value (NAV) per unit was unchanged at S$1.73. During the period, MPACT redeemed S$250 million of perpetual securities and issued S$200 million of fixed-rate notes. Removing the perpetual securities is a small positive for unitholders, because distributions to perpetual holders rank ahead of ordinary unitholders.
| Capital management metric | 30 September 2026 | 30 June 2026 | 30 September 2025 |
|---|---|---|---|
| Gross debt | S$5,913 million | S$5,845 million | S$6,016 million |
| Aggregate leverage | 38.1% | 37.7% | 37.6% |
| Interest coverage ratio | 3.3 times | 3.3 times | 3.0 times |
| All-in cost of debt | 2.95% | 2.94% | 3.23% |
| Fixed-rate debt | 71.8% | 77.4% | 77.5% |
| Average term to maturity | 3.2 years | 3.3 years | 3.5 years |
Aggregate leverage edged up to 38.1%, which the manager attributed mainly to extra borrowing for working capital. This is still comfortably below the regulatory limit for Singapore REITs. The interest coverage ratio of 3.3 times is healthy, and the manager’s own stress test shows it would stay at 3.0 times if earnings fell 10%, or 2.5 times if interest rates rose by one percentage point.
Two things caught my attention here. First, the share of fixed-rate debt fell from 77.4% to 71.8% in one quarter, as some loans and interest rate hedges matured. That leaves MPACT more exposed to interest rate movements. Second, the all-in cost of debt has stopped falling. It was 2.94% for the first quarter and 2.95% for the half year. The manager itself has cautioned that the room for further interest savings is likely to narrow if rates rise. Since lower finance costs have been the main thing holding up the DPU, this is something I will be watching closely.
On the positive side, about 94% of expected distributable income is either earned in Singapore dollars or hedged into Singapore dollars, which limits currency risk. The debt maturity profile is well spread, and cash plus undrawn facilities of around S$0.6 billion provide a liquidity buffer. Moody’s continues to rate MPACT at Baa2, though the outlook remains negative.
Sustainability Recognition
MPACT was named a Sector Leader in the 2026 GRESB Real Estate Assessment, both globally and in Asia, for listed diversified office and retail property. It also moved up to a five-star GRESB rating and kept its top Level A score for public disclosure. While this does not directly affect distributions, strong sustainability credentials can help attract institutional investors and tenants who care about environmental standards.
What the Distribution Means for Income Investors
If I annualise the first-half DPU of 3.90 cents, I get roughly 7.80 Singapore cents per unit for the full year, assuming the second half is similar to the first. MPACT closed at S$1.15 on 2 November 2026, which works out to an annualised distribution yield of about 6.8% at that price. Of course, your own yield depends on the price you actually paid for your units.
Comparing price to the NAV of S$1.73 per unit is also useful. At S$1.15, MPACT trades at a price-to-book ratio of about 0.66 times, or a discount of roughly 34% to its NAV. In other words, investors are buying into the property portfolio at about two-thirds of its independent valuation. That deep discount reflects the market’s caution about the overseas assets, the shrinking DPU and the risk of higher interest costs. For investors who believe the Singapore assets will keep doing the heavy lifting, it also means a margin of safety on the asset value.
For the second-quarter distribution of 1.94 cents, the books closure date is 5.00 p.m. on Tuesday, 10 November 2026, and payment is expected on Wednesday, 16 December 2026. You need to hold the units before the ex-distribution date to qualify.
My Thoughts and What to Watch
Looking at the bigger picture, MPACT is slowly turning into a more Singapore-focused REIT. Singapore now makes up about 61% of assets under management and about 68% of NPI. VivoCity and MBC together generated about 59% of first-half NPI. That concentration is a strength, because the Singapore assets are performing well and have clear catalysts.
For the coming quarters, I see three key factors. The first is whether MBC’s new leases start contributing on schedule from the third quarter, which should help lift Singapore income. The second is the direction of interest costs. The big savings from debt reduction are now largely in the numbers, and with less fixed-rate debt, any rise in rates will flow through faster. The third is whether the overseas portfolio can stabilise. Hong Kong retail is showing early signs of recovery, but China and the Makuhari submarket in Japan could take a long time to turn around.
The manager has indicated that it intends to keep sharpening the portfolio towards quality assets in core markets, which I read as a signal that further divestments of weaker overseas assets are possible. If those sales happen at reasonable prices and the proceeds go towards paying down debt or funding Singapore opportunities, that would be welcome.
For comparison with last year’s trend, you can also read my earlier review of the MPACT 2Q FY25/26 financial results.
Conclusion on the MPACT 2Q FY26/27 Financial Results
Overall, the MPACT 2Q FY26/27 financial results were a mixed bag. DPU fell 3.5% year-on-year to 1.94 cents for the quarter, and 3.0% to 3.90 cents for the half year, mainly because of weaker overseas income and the loss of rent from divested assets. VivoCity’s strong growth and a sharp drop in finance expenses kept the decline modest. Occupancy improved in almost every market, NAV held at S$1.73, and leverage remains manageable at 38.1%.
The near-term story depends on MBC’s new leases kicking in and on whether interest costs stay under control as the hedges roll off. At a closing price of S$1.15, MPACT offers an annualised yield of about 6.8% and trades at roughly a 34% discount to NAV. For investors who believe in VivoCity and the Singapore portfolio, and who can accept continued softness in China and Japan, that is a reasonable income stream at an undemanding valuation. I will continue to track the trust and share my updates when the third-quarter results are released.
Disclaimer: This article is for general information and educational purposes only and does not constitute financial advice. Please do your own research or consult a licensed financial adviser before making any investment decisions.